Notes:
- There may be a minor discrepancies between these figures and those published by Calif. DWR, which uses the Oct. 1 Water Year instead of the historical meteorological rainfall season of July 1 to June 30.
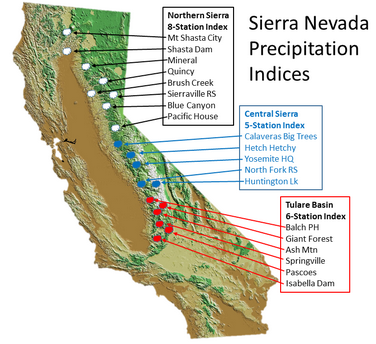
- The averages for the three Sierra Nevada Indices (Northern Sierra, San Joaquin and Tulare) have been recalculated to correspond with the standardized 1981-2010 30-year normals, as inexplicably DWR uses the rather non-standard average period of 1922-1998 (76-year) for the 8-Station Index and 1961-2010 (50-year) for the 5 and 6-Station Indices.
| RAINFALL SEASON | |||
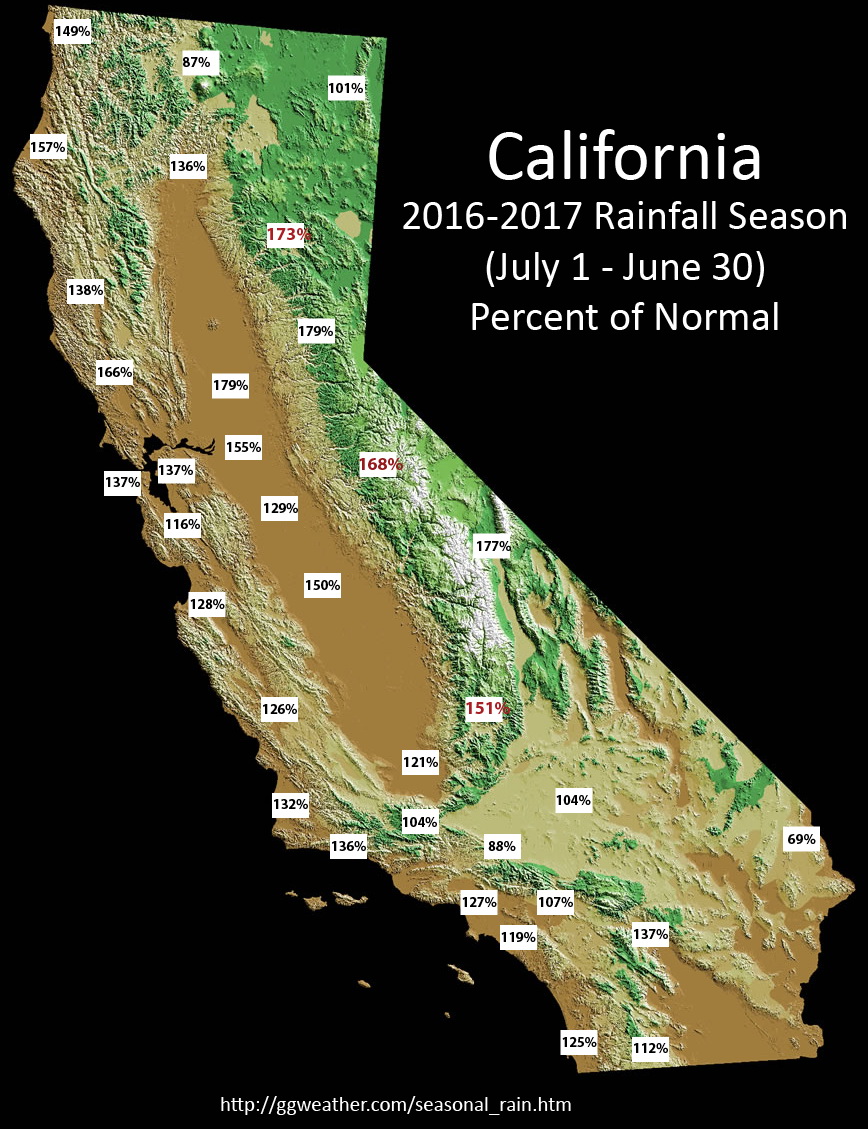
| Northern California | Jul 1 to | Full Season | % Normal to date |
| 30-Jun | Normal | ||
| Crescent City | 95.32 | 64.03 | 149% |
| Eureka | 63.29 | 40.33 | 157% |
| Ukiah | 51.62 | 37.35 | 138% |
| Montague/Siskiyou | 16.10 | 18.47 | 87% |
| Alturas | 14.36 | 14.17 | 101% |
| Mount Shasta City | 59.81 | 43.21 | 138% |
| Redding | 47.03 | 34.62 | 136% |
| Sacramento Exec AP | 33.08 | 18.52 | 179% |
| Sacramento - CSUS | 33.94 | 20.27 | 167% |
| Blue Canyon | 115.54 | 64.62 | 179% |
| Santa Rosa | 60.37 | 36.28 | 166% |
| San Francisco Downtown | 32.37 | 23.65 | 137% |
| SFO Airport | 30.92 | 20.65 | 150% |
| Oakland Airport | 28.48 | 20.81 | 137% |
| Livermore | 25.38 | 15.71 | 162% |
| Mountain View - Moffett | 18.15 | 14.68 | 124% |
| San Jose | 18.42 | 15.82 | 116% |
| Nrn Sierra 8-Station Index (map) | 94.28 | 54.52 | 173% |
| Central California... | Jul 1 to | Full Season | % Normal to date |
| 30-Jun | Normal | ||
| Stockton | 21.78 | 14.06 | 155% |
| Modesto | 16.93 | 13.11 | 129% |
| Merced | 16.03 | 12.50 | 128% |
| Madera | 14.18 | 12.02 | 118% |
| Fresno | 17.20 | 11.50 | 150% |
| Hanford | 11.05 | 10.10 | 109% |
| Bakersfield | 7.82 | 6.47 | 121% |
| Bishop | 9.16 | 5.18 | 177% |
| Salinas | 16.45 | 12.83 | 128% |
| Paso Robles | 16.14 | 12.78 | 126% |
| Santa Maria | 18.44 | 13.95 | 132% |
| Cntrl Sierra 5-Station Index (map) | 71.52 | 42.57 | 168% |
| Srn Sierra 6-Station Index (map) | 46.17 | 30.50 | 151% |
| Southern California | Jul 1 to | Full Season | % Normal to date |
| 30-Jun | Normal | ||
| Sandberg | 12.79 | 12.33 | 104% |
| Palmdale | 5.93 | 8.30 | 71% |
| Lancaster | 6.51 | 7.38 | 88% |
| Santa Barbara | 24.24 | 17.76 | 136% |
| Camarillo | 19.44 | 15.22 | 128% |
| Burbank - Bob Hope | 13.83 | 17.31 | 80% |
| LAX Airport | 16.33 | 12.82 | 127% |
| Los Angeles Downtown | 19.00 | 14.93 | 127% |
| Long Beach | 19.98 | 12.26 | 163% |
| Fullerton | 16.92 | 13.88 | 122% |
| Irvine - John Wayne | 15.88 | 13.33 | 119% |
| Oceanside | 15.21 | 13.66 | 111% |
| Ramona | 23.23 | 16.04 | 145% |
| San Diego - Lindbergh | 12.97 | 10.34 | 125% |
| Ontario | 15.62 | 15.04 | 104% |
| Riverside | 13.21 | 12.40 | 107% |
| Palm Springs | 7.89 | 5.74 | 137% |
| Thermal | 3.98 | 3.20 | 124% |
| Campo | 17.59 | 15.73 | 112% |
| Barstow-Daggett | 4.22 | 4.06 | 104% |
| Needles | 3.19 | 4.62 | 69% |
| produced by Jan Null, CCM Golden Gate Weather Services jnull@ggweather.com |
 |