Summary: With the periodic reoccurrence of
El Niño and La Niña there are efforts to try and assess what the impact will be
on California, especially the state's water supply. This project examines
the precipitation for both warm and cool ENSO events across California.
Overview: The various ENSO (El
Niño-Southern Oscillation) events have are defined from the
Oceanic Niño Index (ONI)
into Weak, Moderate and Strong events. The moderate and strong
events are highlighted in the tables below. Then the seasonal
(July 1 through June 30) percent of normal precipitation for each
category, plus a collective category of "all" warm and cool events, was
collated for a number of cities and geographic areas. One of these
areas is the Northern Sierra Nevada Eight Station index (8SI) which is
the average of the precipitation totals for Mt.
Shasta City, Shasta Dam, Brush Creek, Mineral Ranger Station, Quincy,
Sierraville Ranger Station, Blue Canyon and Pacific House.
Additionally the seven NCDC climate division (see
map) averages were compared to the ENSO
events. These comparisons was done in terms of both average
seasonal precipitation and also the number of occurrences within percent
of normal categories. For ease of viewing, the moderate and strong
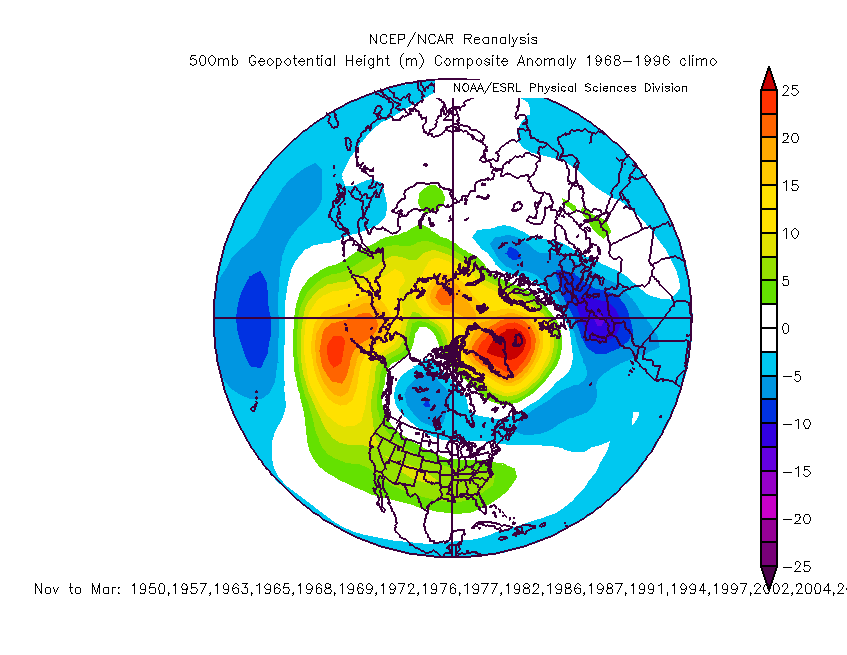
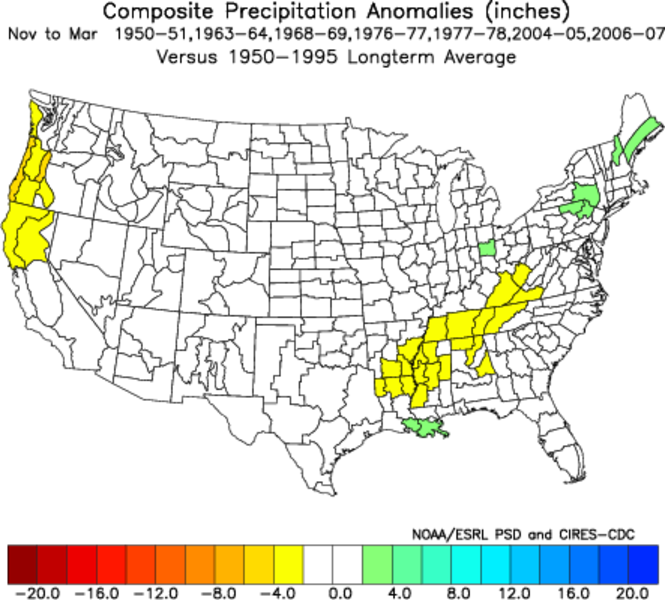
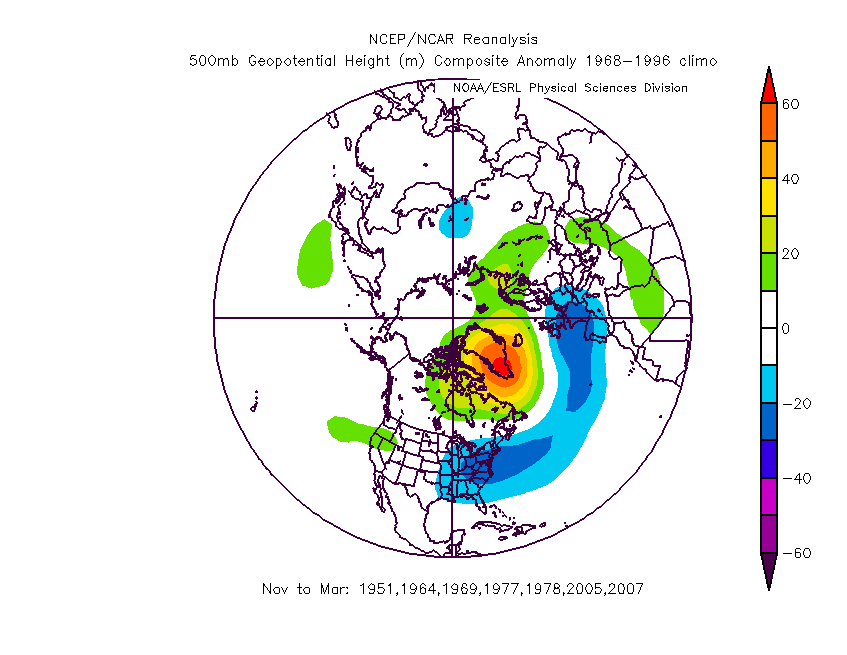
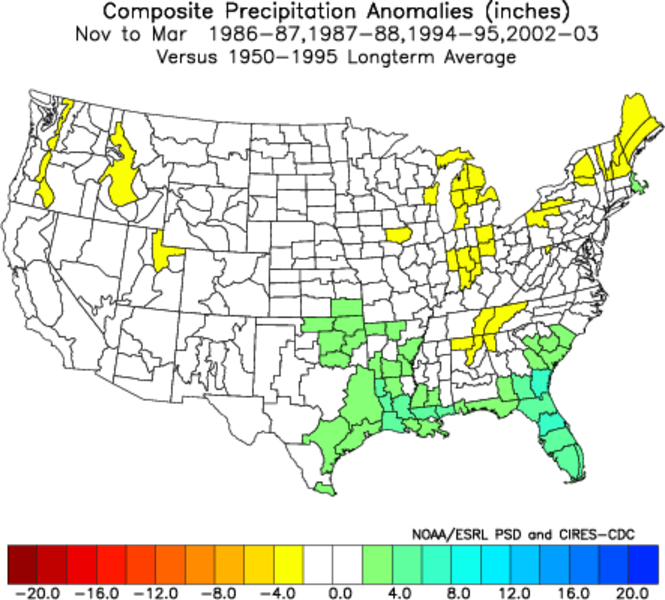
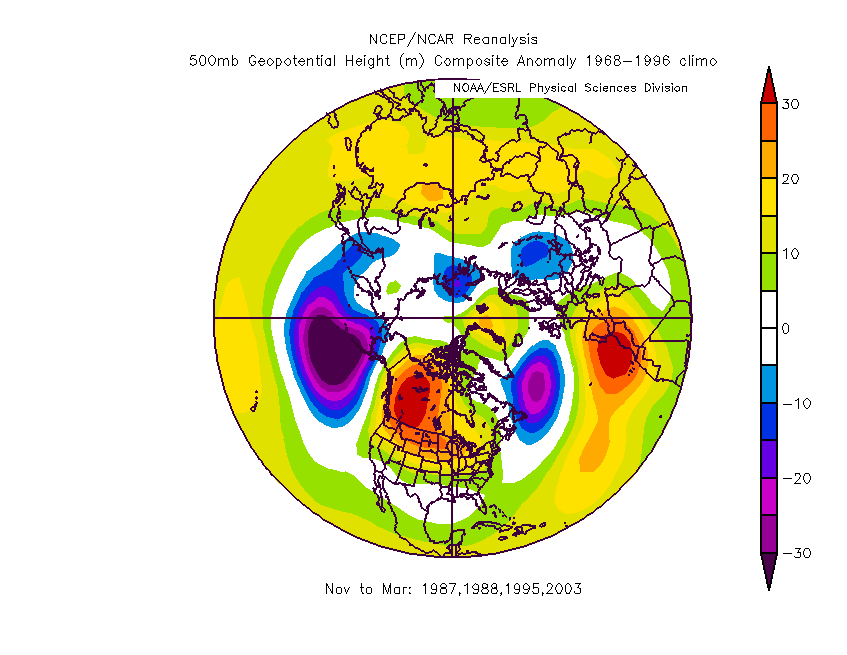
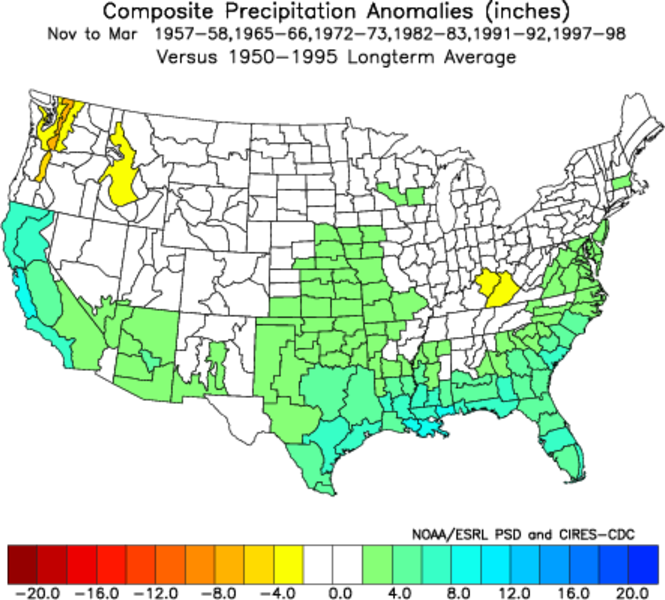
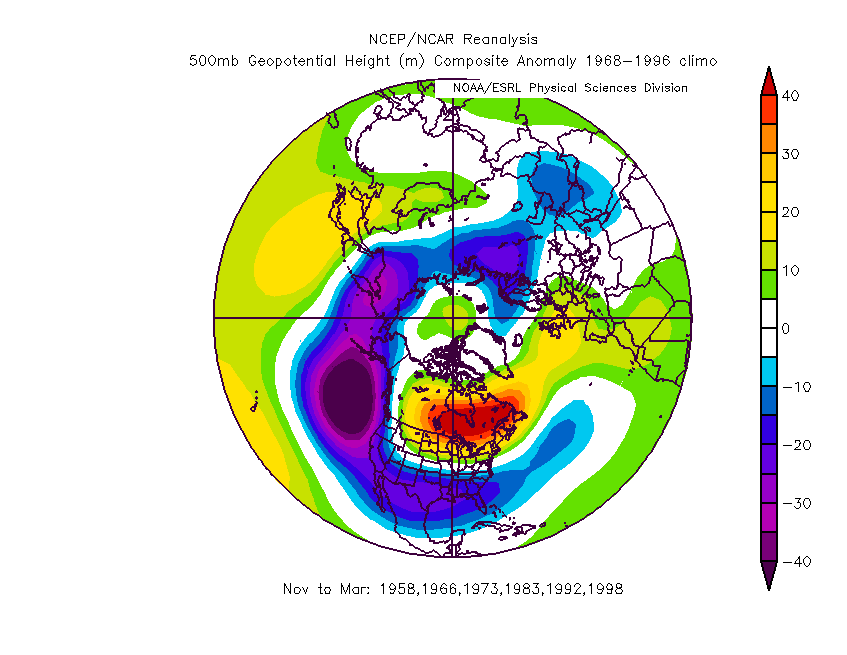
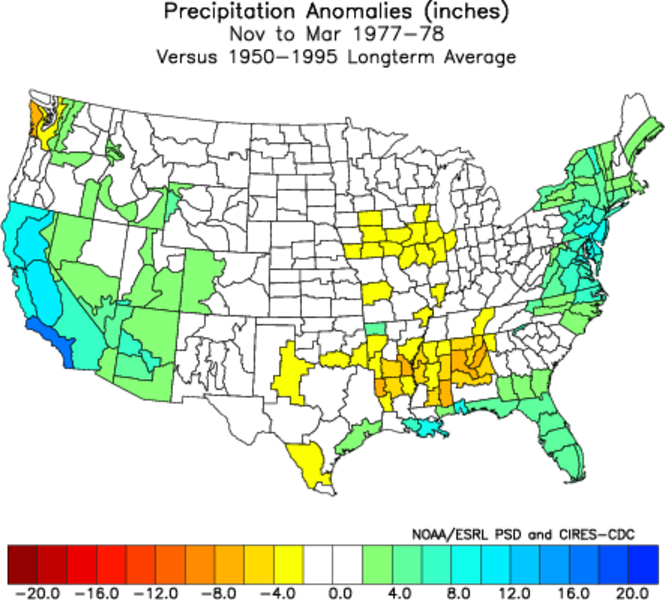
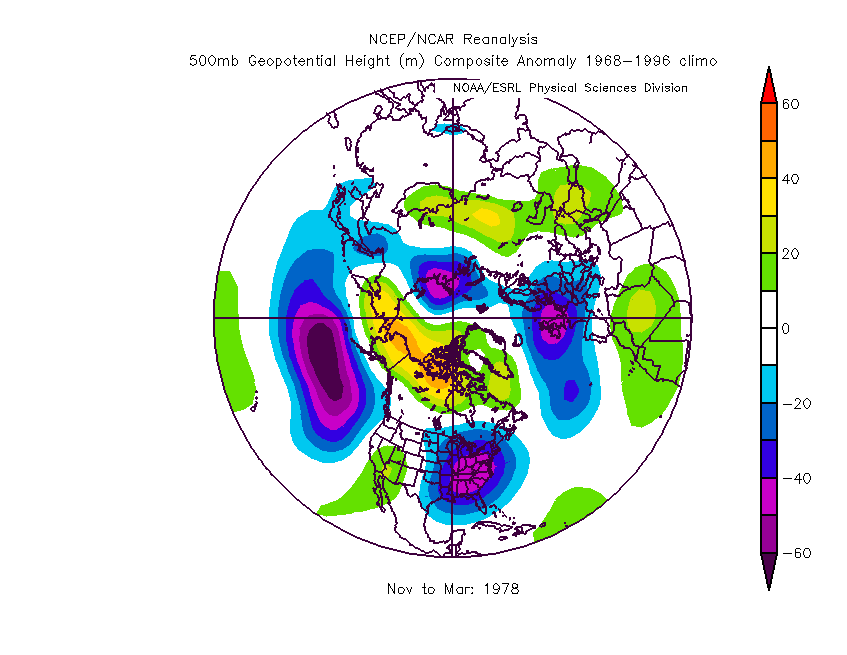
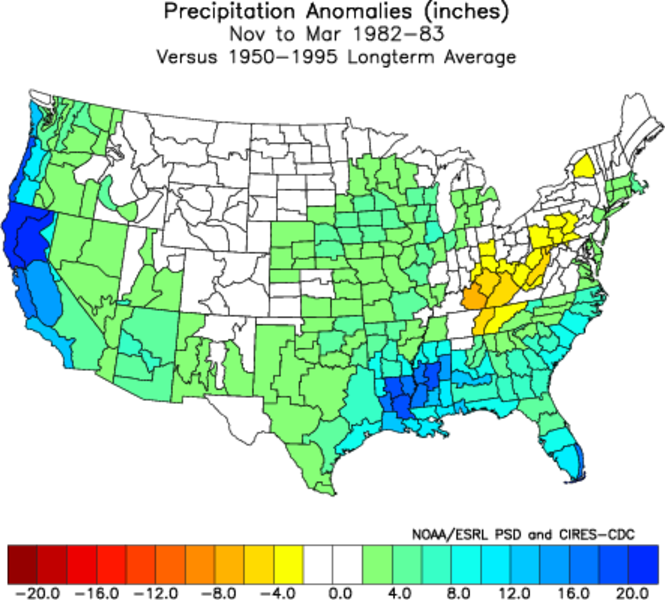
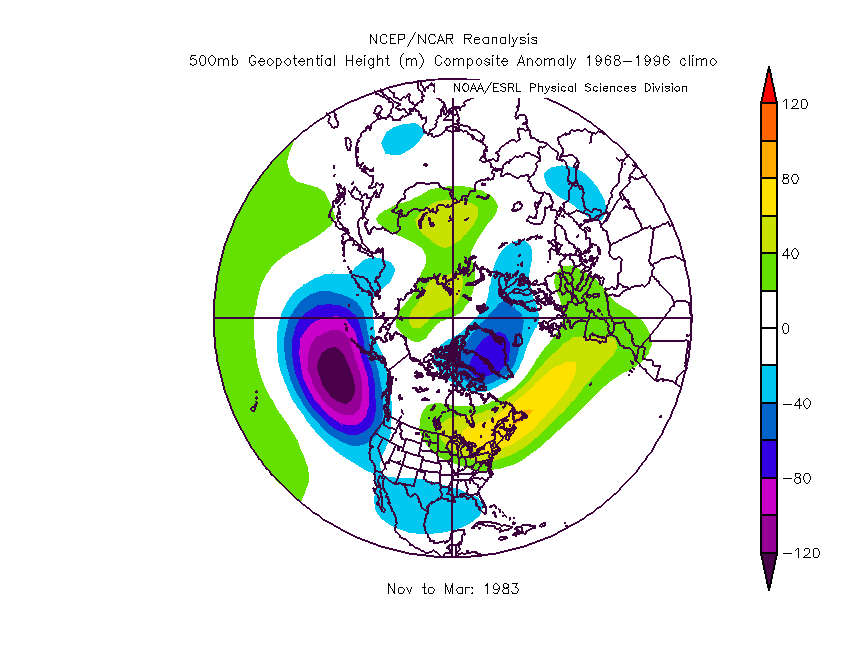
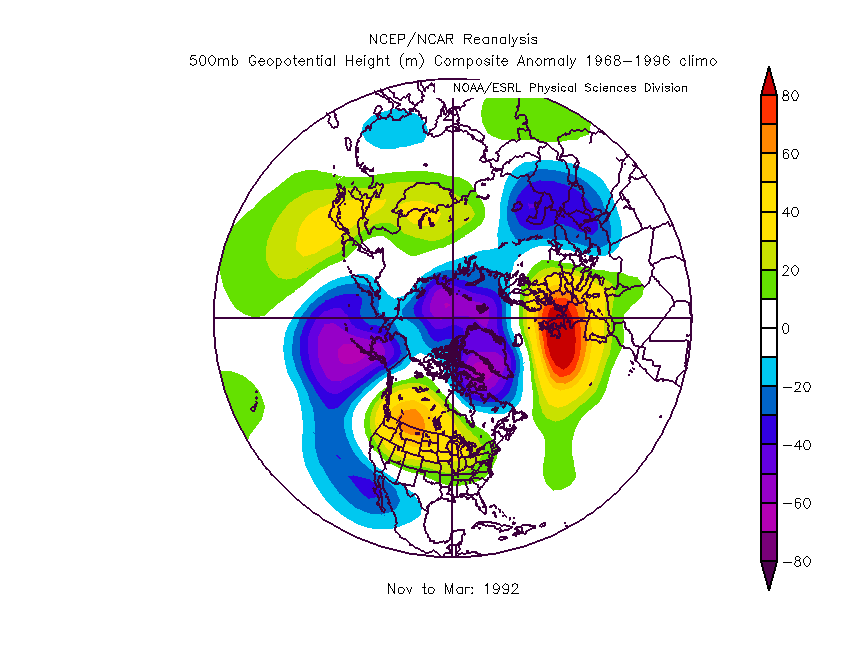
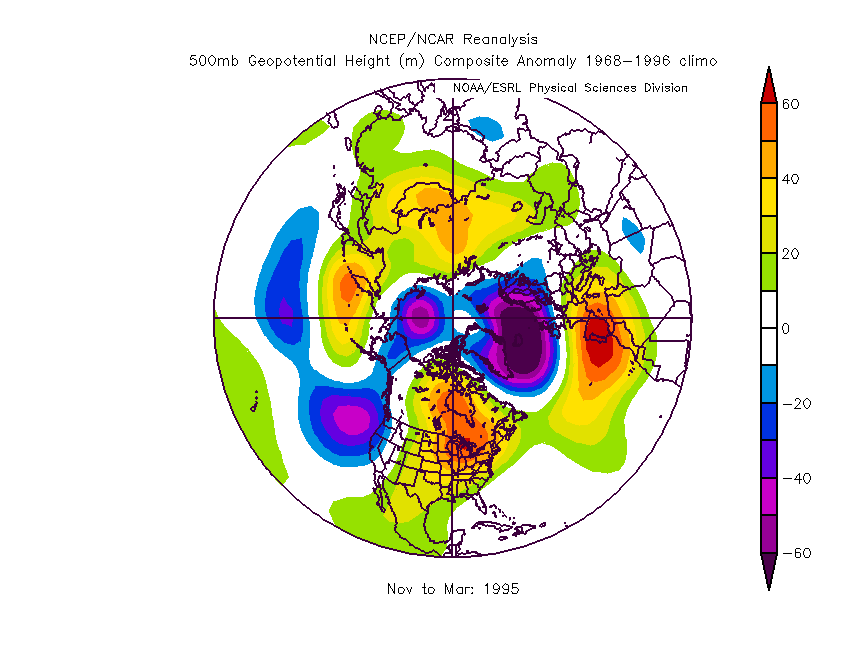
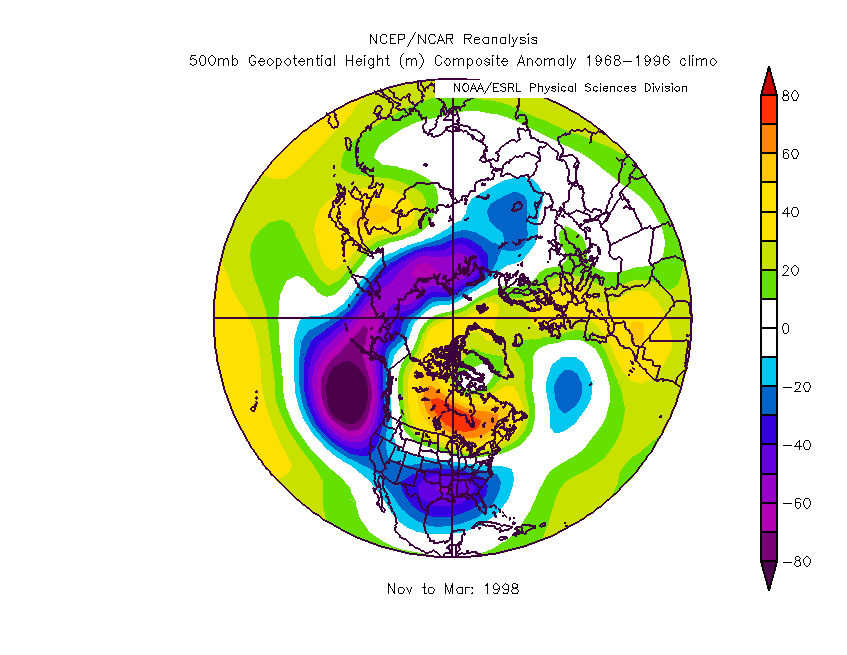
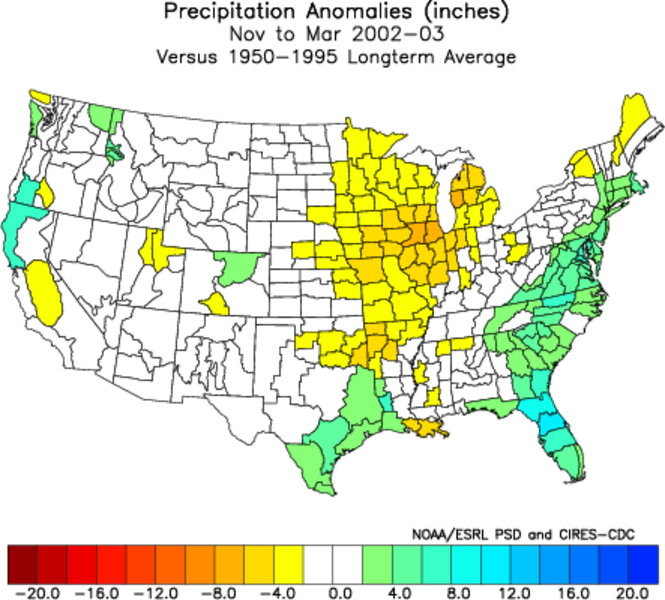
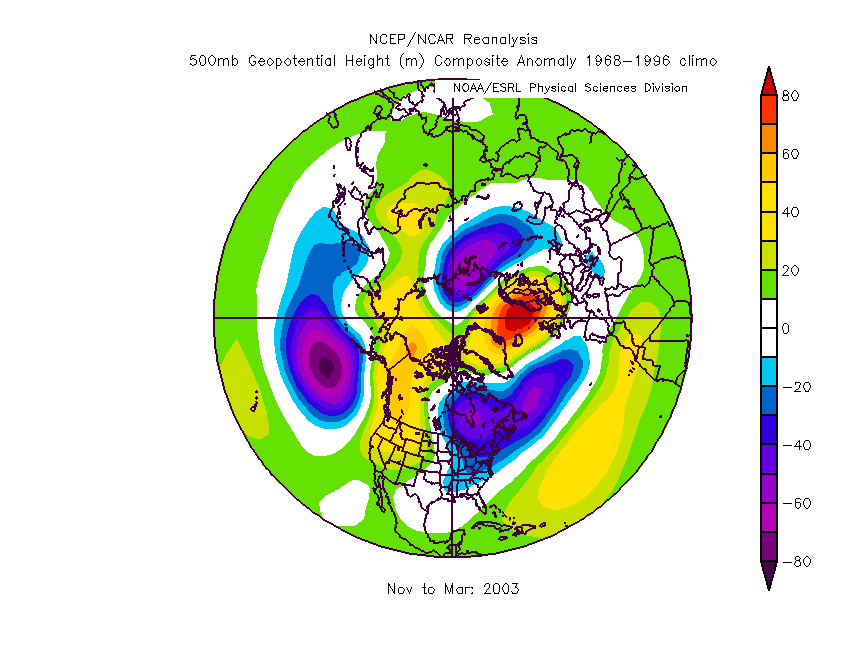
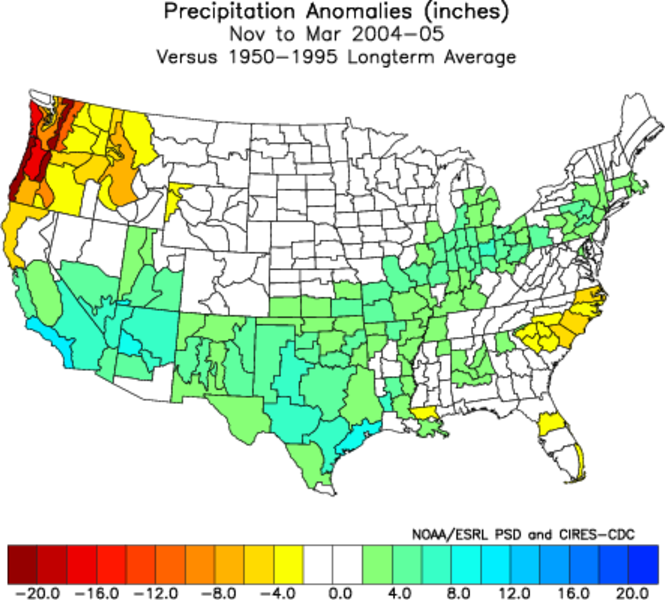
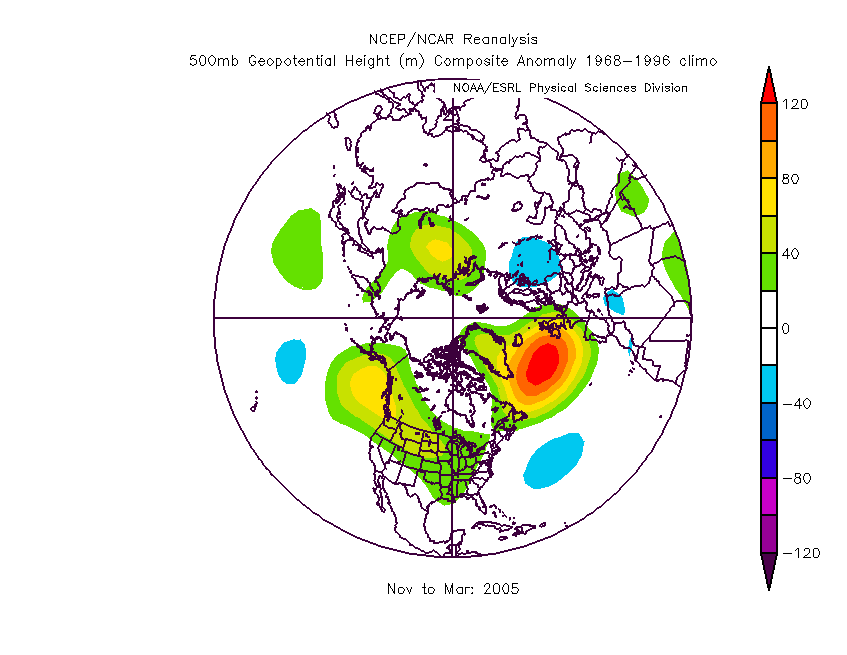
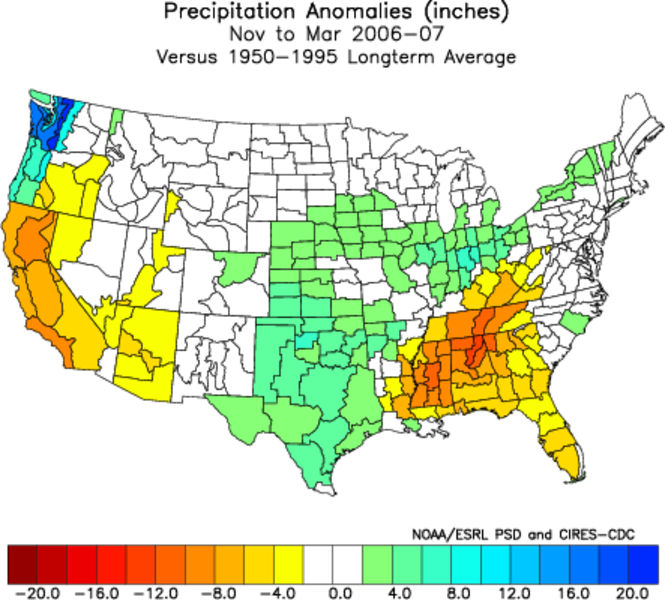
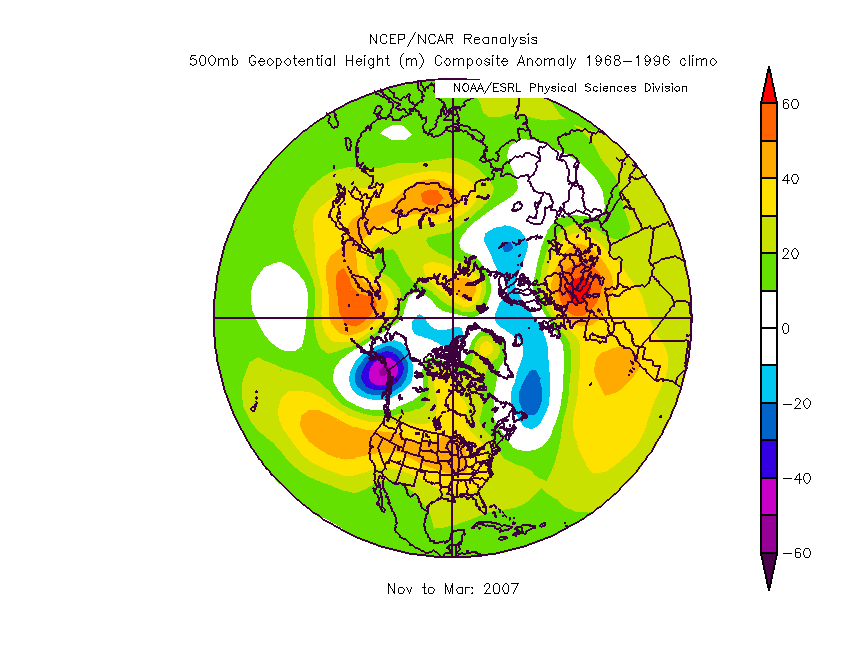
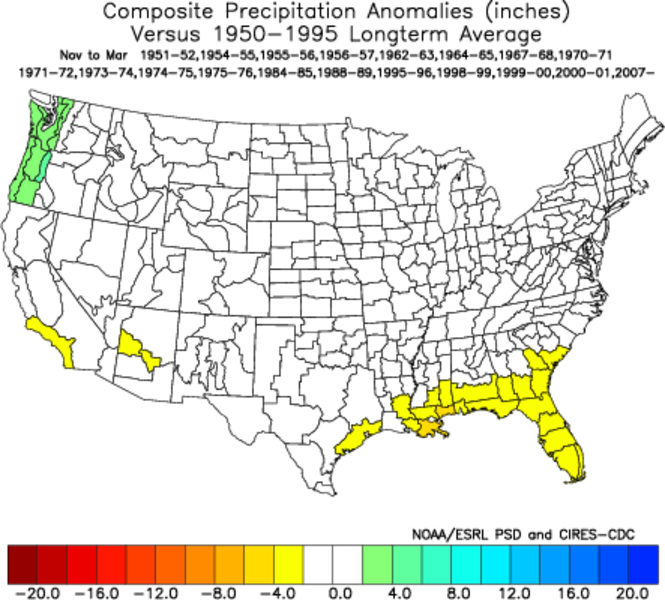
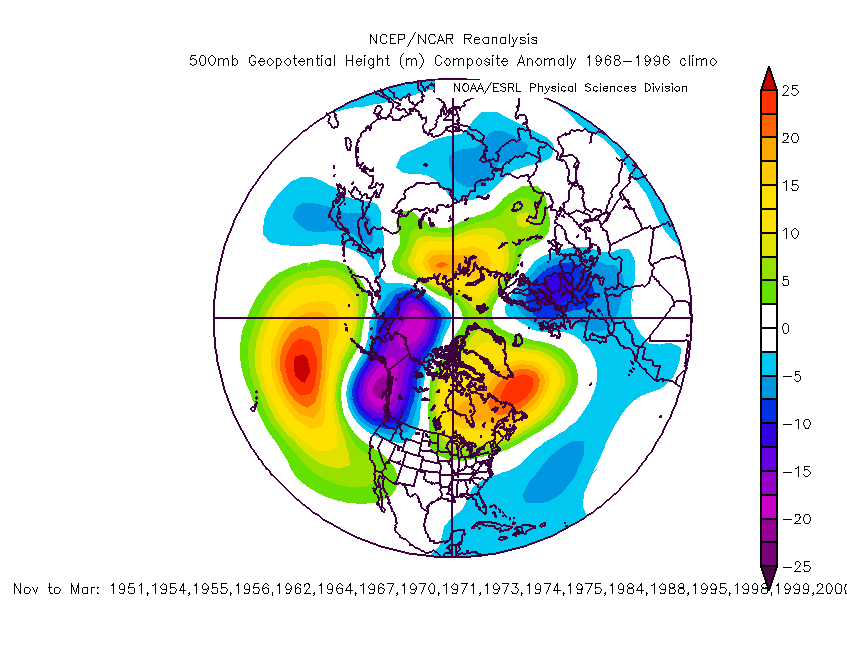
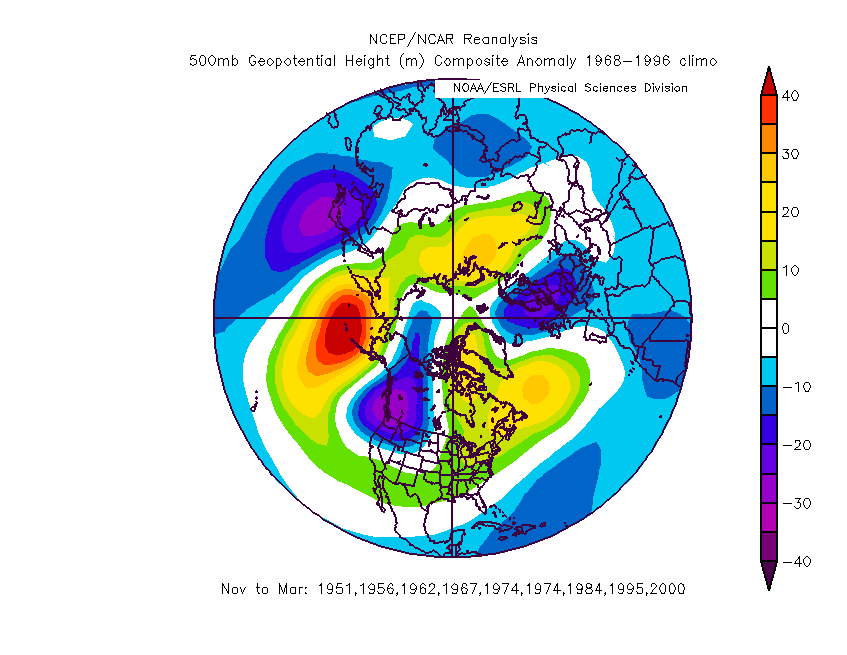
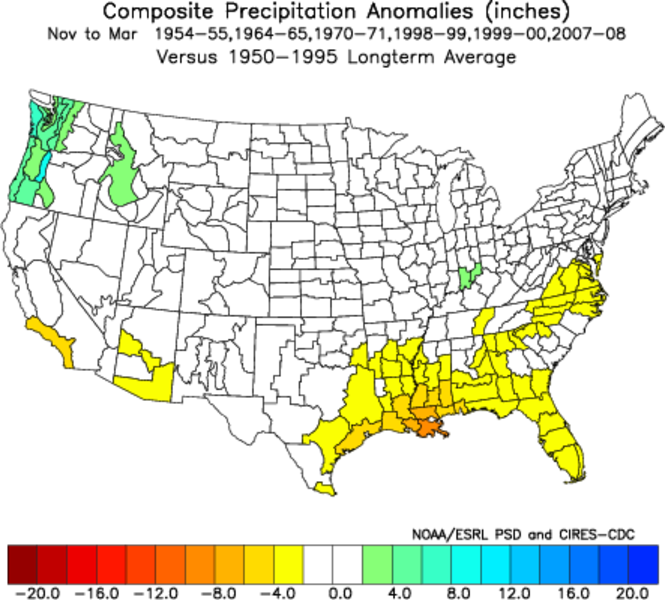
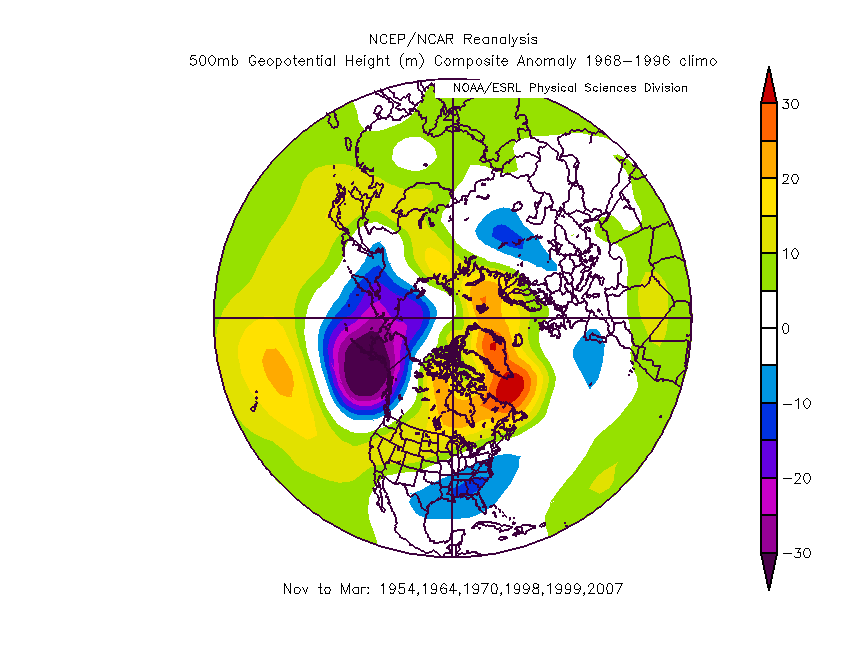
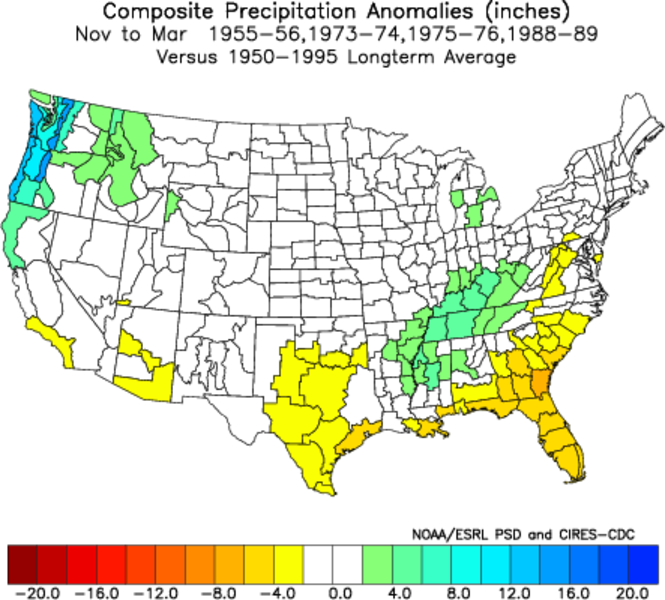
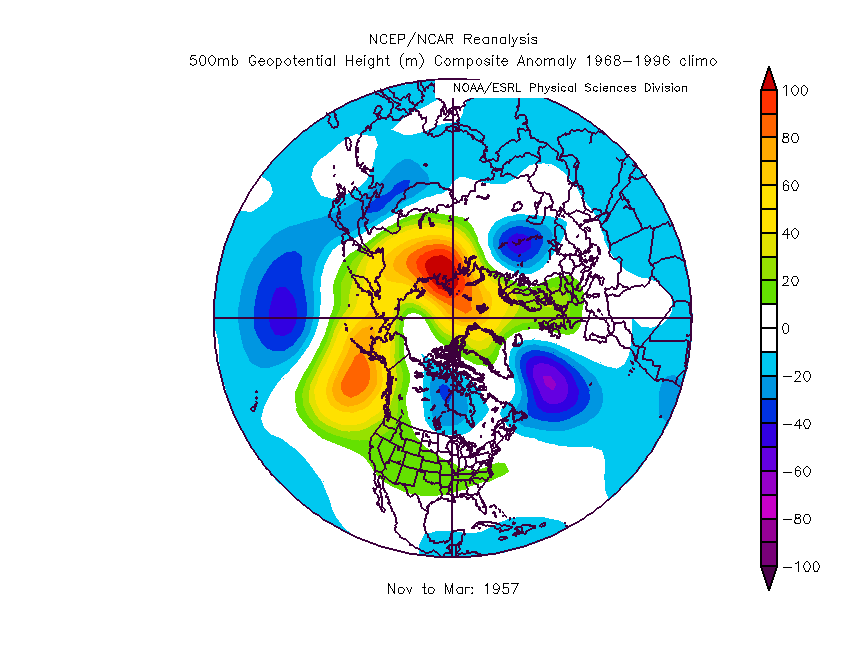
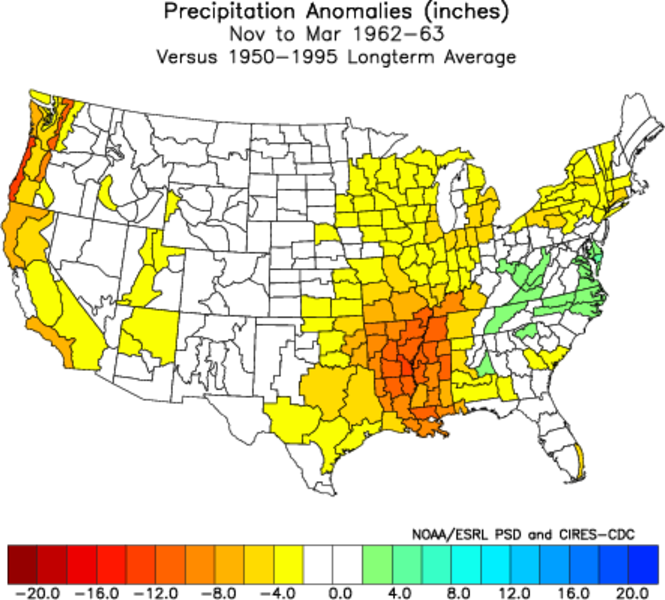
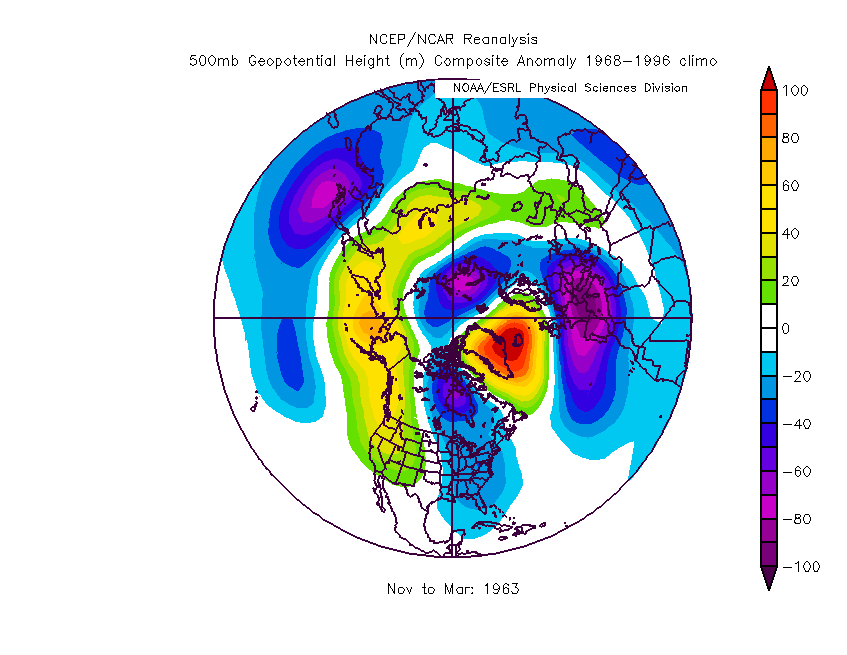
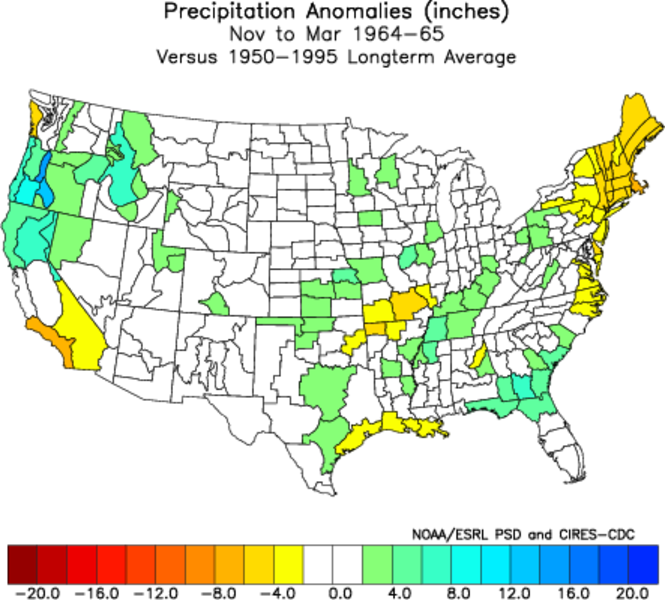
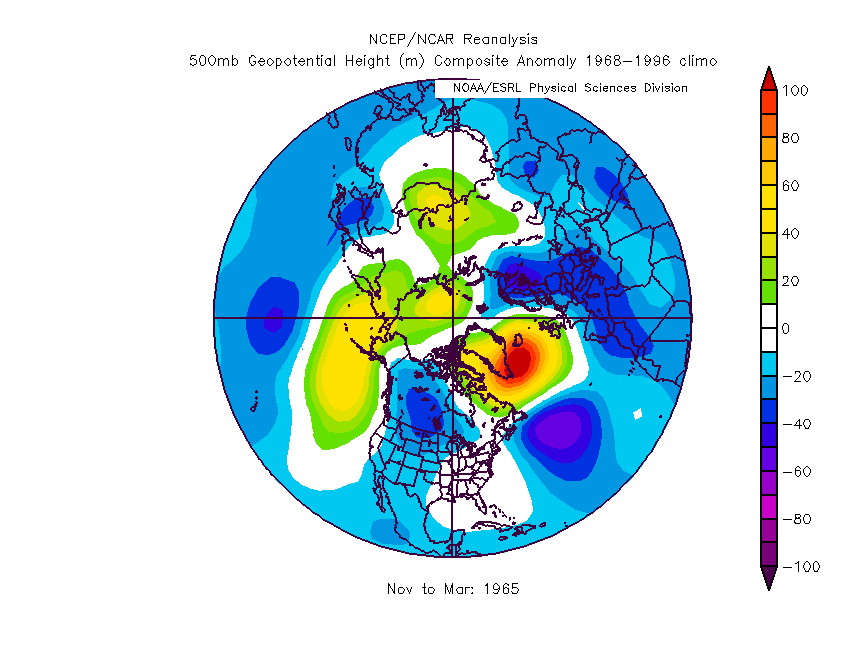
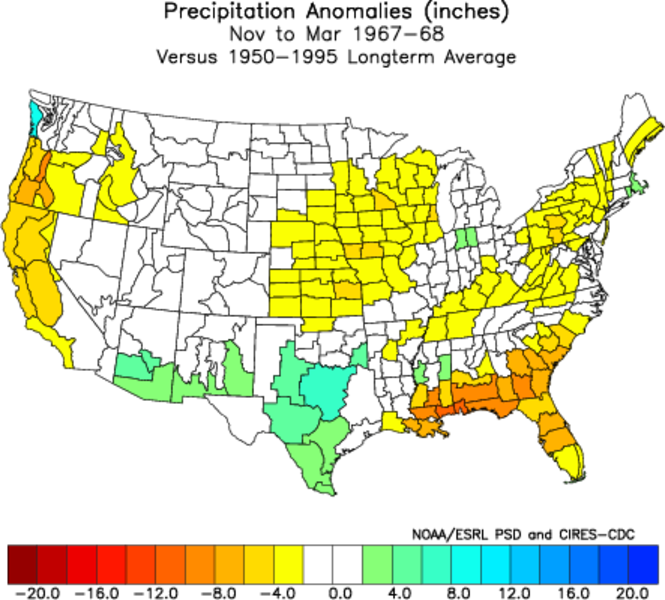
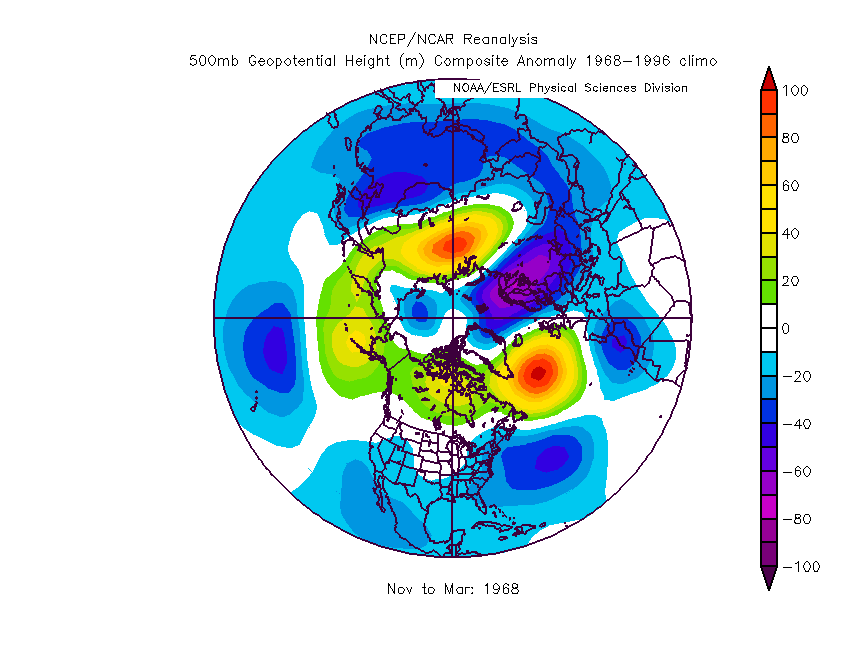
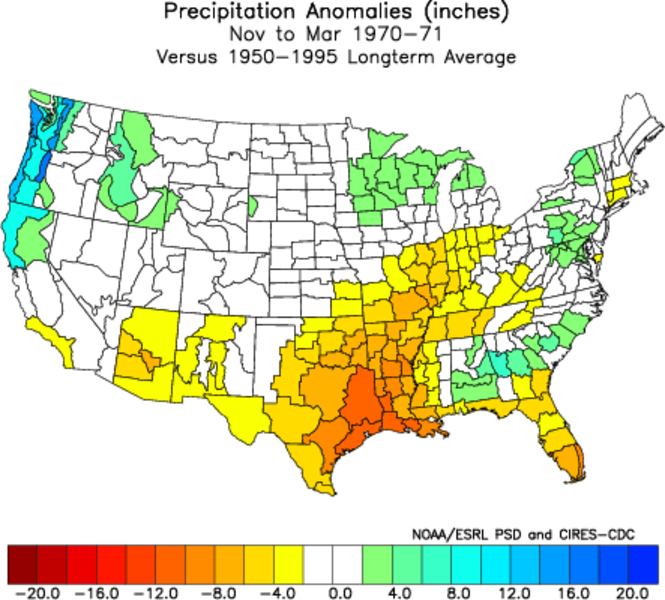
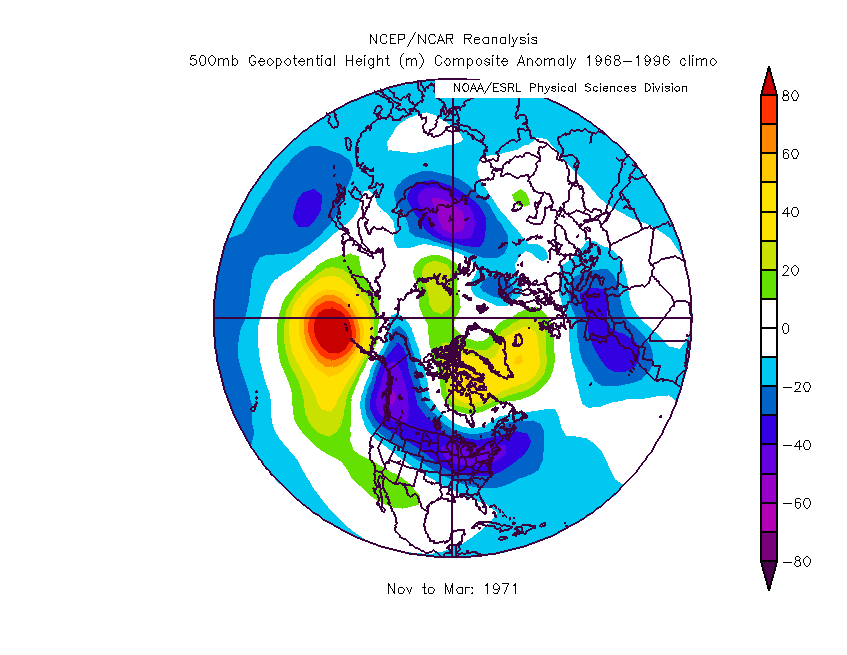
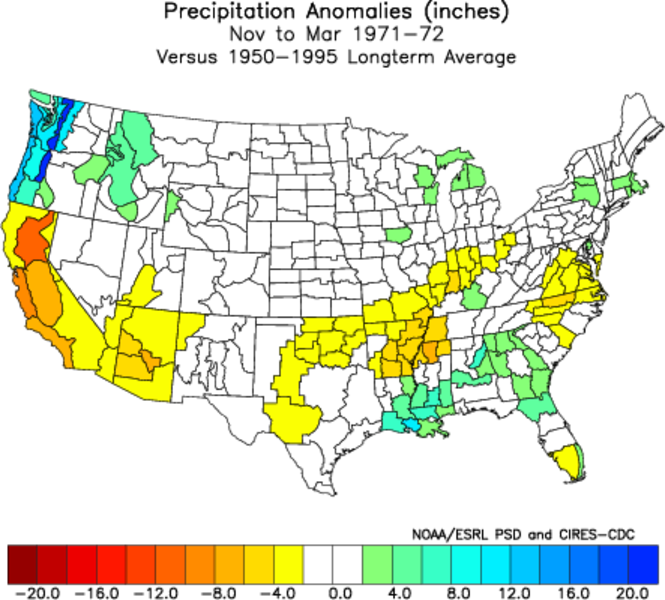
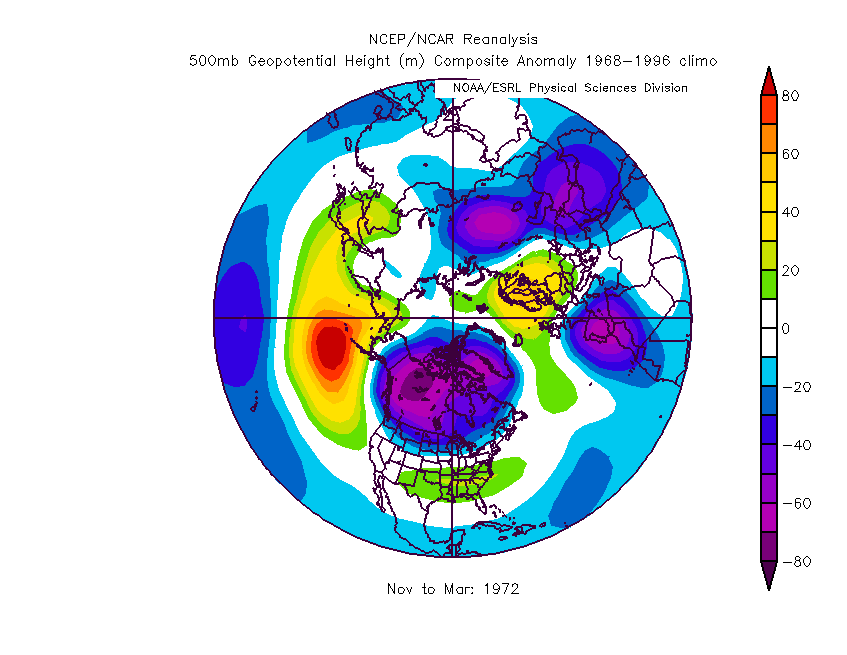
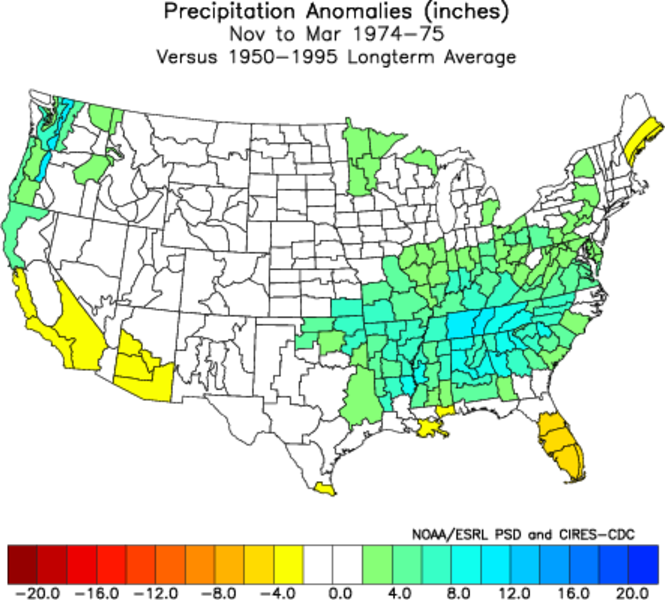
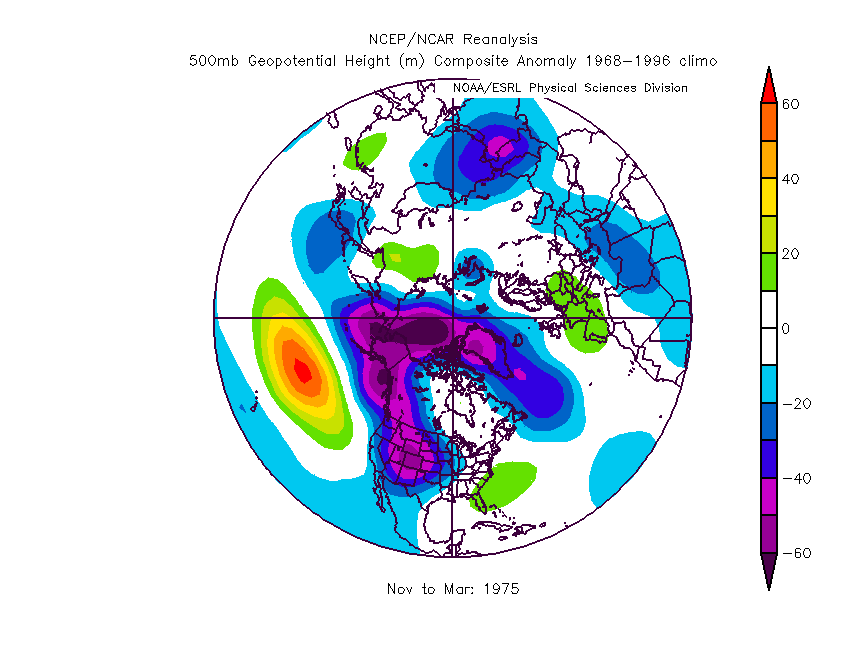
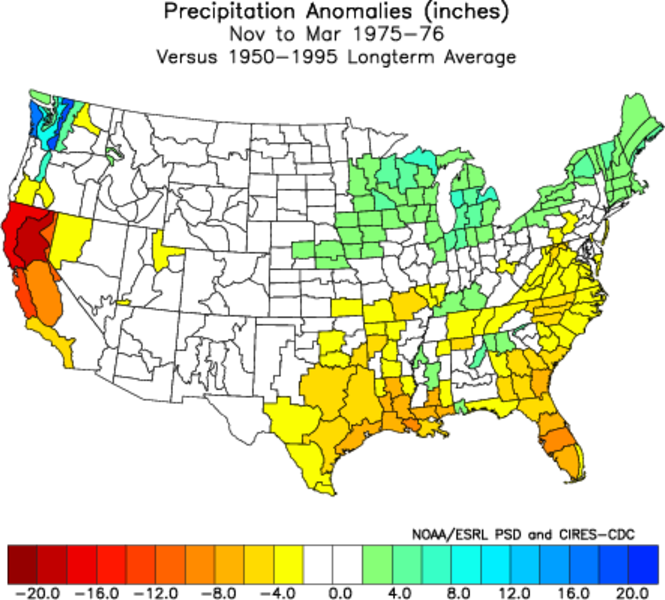
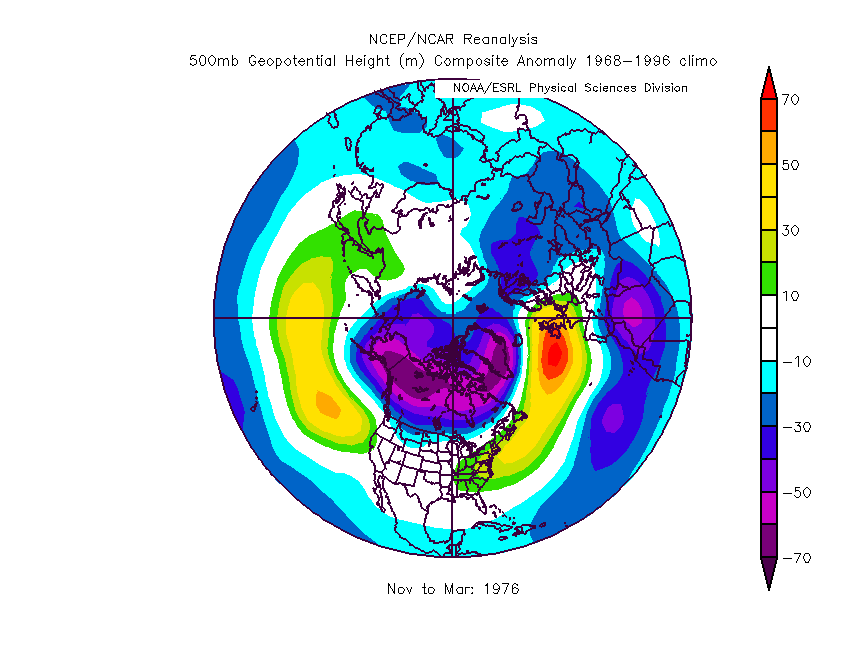
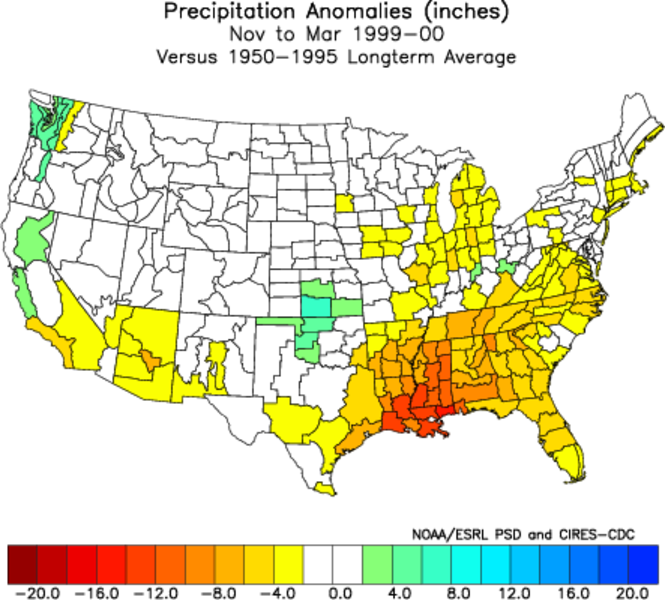
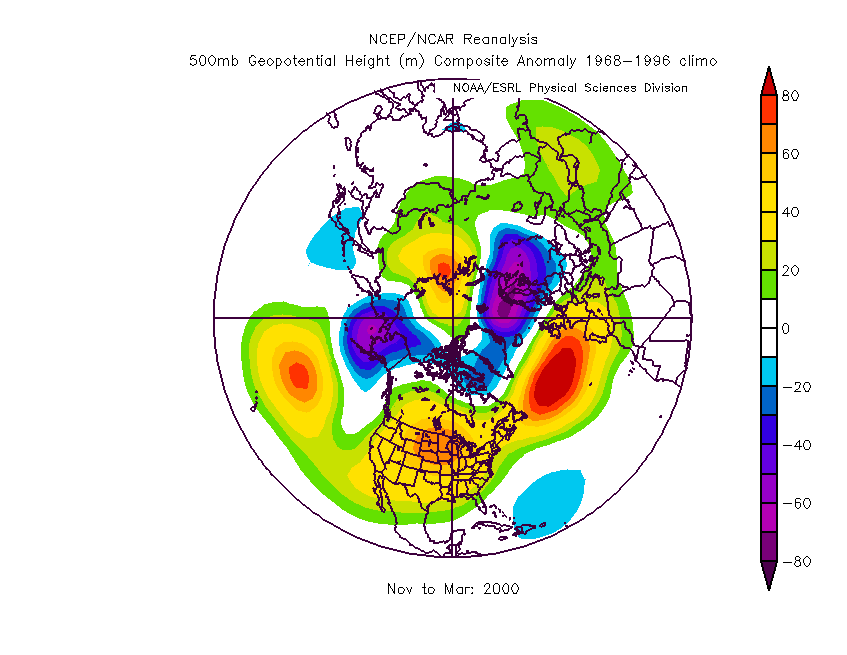
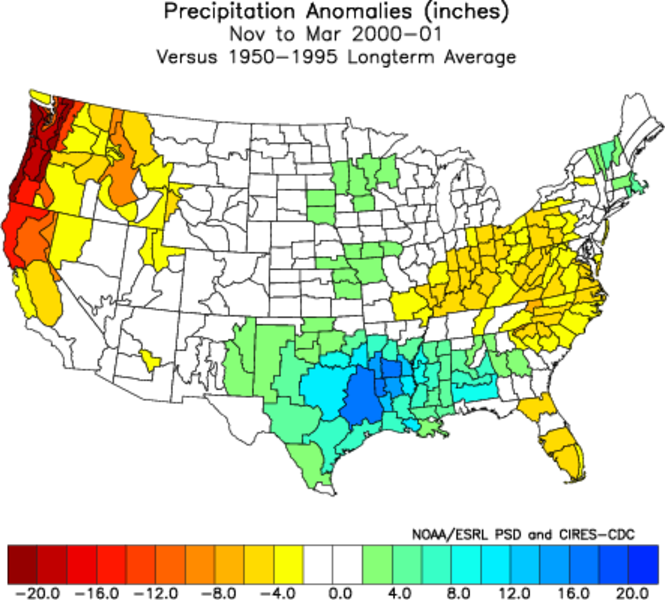
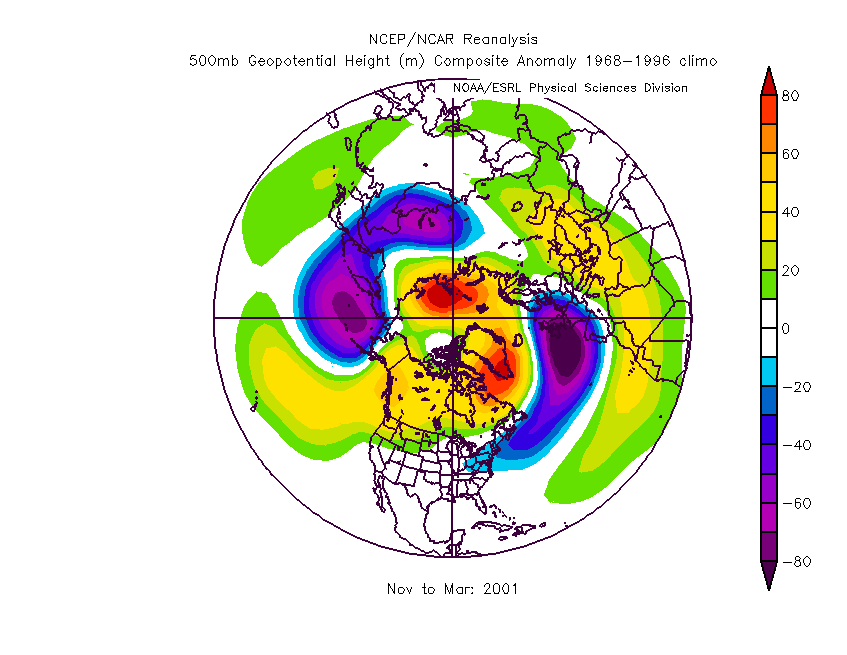
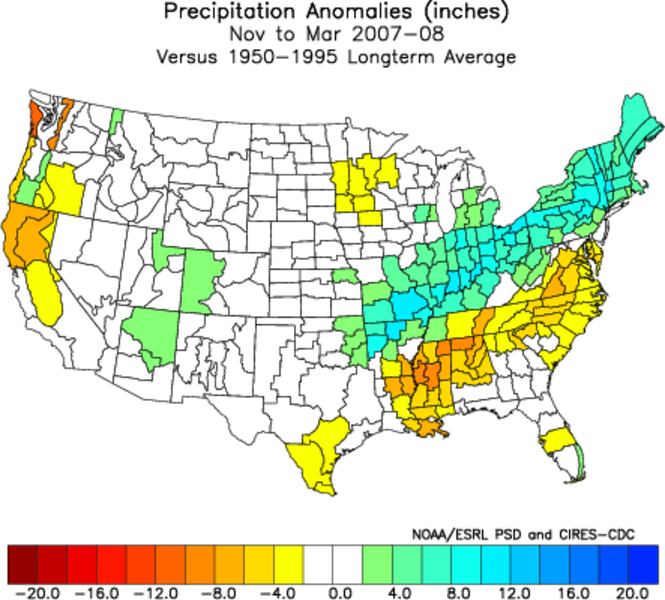
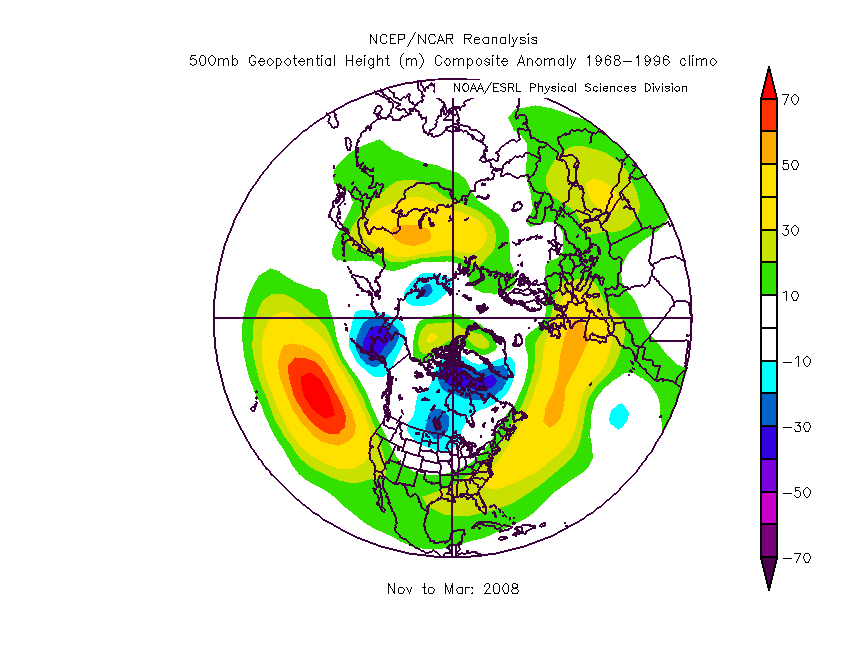
events have been highlighted. Finally, anomaly maps, were
constructed for each season showing the precipitation and 500-hPa
anomalies for the primary "rainy" season of November through March.
Observations:
El Niño: The best
"signal" associated with warm ENSO (El Niño) events is, as would be
expected, with the "Strong" events, especially in Southern California.
For the six seasons categorized as strong, all regions averaged above
normal precipitation with the highest percentages of normal (PON) in
Climate Divisions 6 and 7. Likewise, Divisions 6 (including Los
Angeles) and 7 above normal and precipitation for all the Strong El Niño
seasons. During weak and moderate warm events there is no such
signal with the number of years of above and below normal being fairly
evenly split statewide.
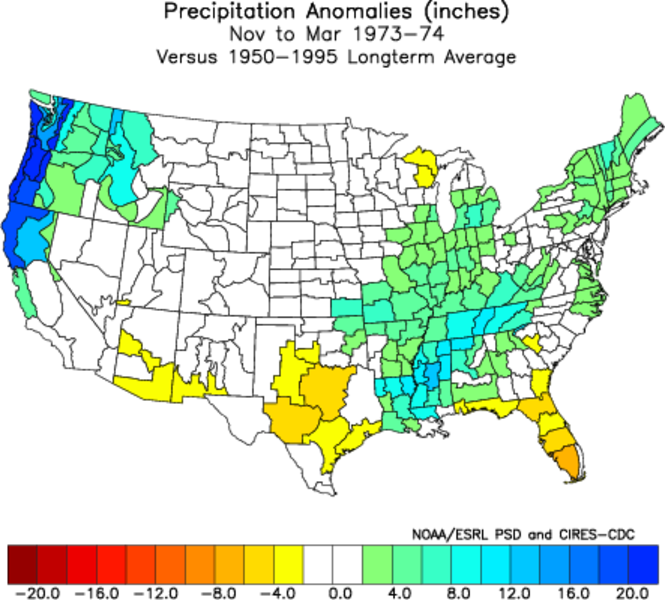
La Niña: During cool (La
Niña) ENSO events the only real signal is during Strong events with
below normal precipitation in Southern California (Division 6 and 7).
The average rainfall during strong La Niñas in Southern California is
about 68% with all seasons being below normal. Like the warm
events there is no prevailing precipitation anomaly elsewhere during
strong cool events or during weak or moderate events.
El Niño
Table 1. All El Niño Events - Average Percent of Normal Precipitation
(18 events)
|
ENSO Type |
Eureka |
San Francisco |
Sacramento |
Fresno |
Los Angeles |
8SI |
Div. 1 |
Div. 2 |
Div. 3 |
Div. 4 |
Div. 5 |
Div. 6 |
Div. 7 |
Anomaly Maps |
|
All El Niño |
103 |
117 |
108 |
116 |
132 |
106 |
106 |
104 |
97 |
112 |
107 |
122 |
125 |
Precip |
500-hPa |
|
Weak El Niño |
99 |
102 |
100 |
114 |
130 |
102 |
98 |
94 |
96 |
102 |
104 |
118 |
129 |
Precip |
500-hPa |
|
Moderate El Niño |
107 |
103 |
88 |
106 |
102 |
102 |
104 |
103 |
91 |
96 |
97 |
103 |
100 |
Precip |
500-hPa |
|
Strong El Niño |
110 |
148 |
135 |
143 |
164 |
119 |
122 |
122 |
109 |
140 |
126 |
147 |
146 |
Precip |
500-hPa |
Table 2. All El Niño - Years by Percent of Normal
Categories (18 events)
|
% of Normal |
Eureka |
San Francisco |
Sacramento |
Fresno |
Los Angeles |
8SI |
Div. 1 |
Div. 2 |
Div. 3 |
Div. 4 |
Div. 5 |
Div. 6 |
Div. 7 |
| <80% |
3 |
5 |
7 |
5 |
4 |
7 |
6 |
8 |
6 |
6 |
7 |
4 |
3 |
| 80-100% |
7 |
3 |
2 |
3 |
2 |
1 |
1 |
0 |
3 |
2 |
2 |
2 |
2 |
|
100-120% |
1 |
2 |
0 |
1 |
1 |
3 |
4 |
3 |
4 |
1 |
1 |
4 |
3 |
|
120-140% |
5 |
1 |
5 |
2 |
1 |
4 |
3 |
4 |
2 |
2 |
3 |
0 |
1 |
| >140% |
2 |
7 |
4 |
7 |
10 |
3 |
4 |
3 |
3 |
7 |
5 |
8 |
9 |
Table 3. Weak El Niño - Years by Percent of Normal Categories
(8 events)
|
% of Normal |
Eureka |
San Francisco |
Sacramento |
Fresno |
Los Angeles |
8SI |
Div. 1 |
Div. 2 |
Div. 3 |
Div. 4 |
Div. 5 |
Div. 6 |
Div. 7 |
| <80% |
1 |
3 |
3 |
3 |
3 |
3 |
3 |
4 |
2 |
3 |
3 |
3 |
2 |
| 80-100% |
4 |
1 |
1 |
1 |
1 |
0 |
0 |
0 |
1 |
1 |
1 |
1 |
1 |
|
100-120% |
1 |
1 |
0 |
0 |
0 |
2 |
2 |
1 |
3 |
0 |
0 |
0 |
1 |
|
120-140% |
2 |
1 |
3 |
1 |
0 |
3 |
3 |
3 |
1 |
1 |
2 |
0 |
0 |
| >140% |
0 |
2 |
1 |
3 |
4 |
0 |
0 |
0 |
1 |
3 |
2 |
4 |
4 |
Table 4. Moderate El Niño - Years by Percent of Normal Categories
(4 events)
|
% of Normal |
Eureka |
San Francisco |
Sacramento |
Fresno |
Los Angeles |
8SI |
Div. 1 |
Div. 2 |
Div. 3 |
Div. 4 |
Div. 5 |
Div. 6 |
Div. 7 |
|
<80% |
1 |
1 |
2 |
1 |
1 |
2 |
2 |
2 |
2 |
2 |
2 |
1 |
1 |
|
80-100% |
1 |
1 |
1 |
2 |
1 |
0 |
0 |
0 |
1 |
0 |
1 |
1 |
1 |
|
100-120% |
0 |
1 |
0 |
0 |
1 |
1 |
1 |
1 |
0 |
1 |
0 |
1 |
1 |
|
120-140% |
2 |
0 |
1 |
0 |
0 |
0 |
0 |
0 |
0 |
0 |
0 |
0 |
0 |
|
>140% |
0 |
1 |
0 |
1 |
1 |
1 |
1 |
1 |
1 |
1 |
1 |
1 |
1 |
Table 5. Strong El Niño - Years by Percent of Normal Categories
(6 events)
|
|
Eureka |
San Francisco |
Sacramento |
Fresno |
Los Angeles |
8SI |
Div. 1 |
Div. 2 |
Div. 3 |
Div. 4 |
Div. 5 |
Div. 6 |
Div. 7 |
| <80% |
1 |
1 |
2 |
1 |
0 |
2 |
1 |
2 |
2 |
1 |
2 |
0 |
0 |
| 80-100% |
2 |
1 |
0 |
0 |
0 |
1 |
1 |
0 |
1 |
1 |
0 |
0 |
0 |
|
100-120% |
0 |
0 |
0 |
1 |
0 |
0 |
1 |
1 |
1 |
0 |
1 |
3 |
1 |
|
120-140% |
1 |
0 |
1 |
1 |
1 |
1 |
0 |
1 |
1 |
1 |
1 |
0 |
1 |
| >140% |
2 |
4 |
3 |
3 |
5 |
2 |
3 |
2 |
1 |
3 |
2 |
3 |
4 |
Table 6. All El Niño Events - Individual Years Percent of Normal
Precipitation (18 events)
|
ENSO Type |
Season |
Eureka |
San Francisco |
Sacramento |
Fresno |
Los Angeles |
8SI |
Div. 1 |
Div. 2 |
Div. 3 |
Div. 4 |
Div. 5 |
Div. 6 |
Div. 7 |
Anomaly Maps |
|
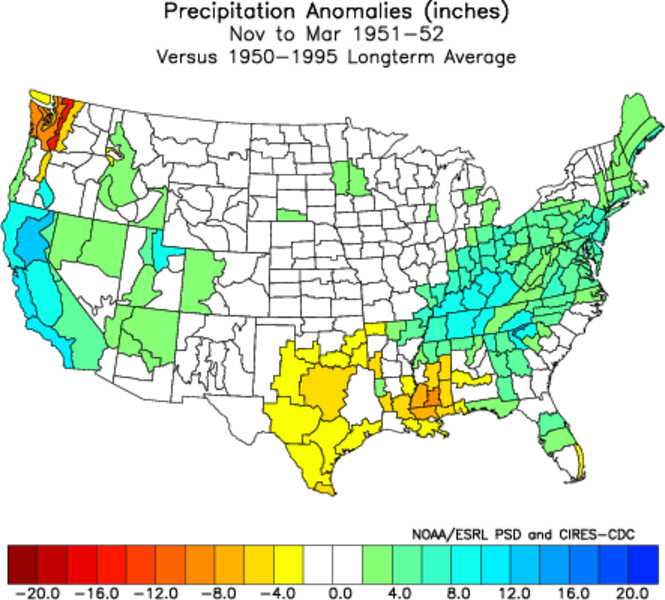
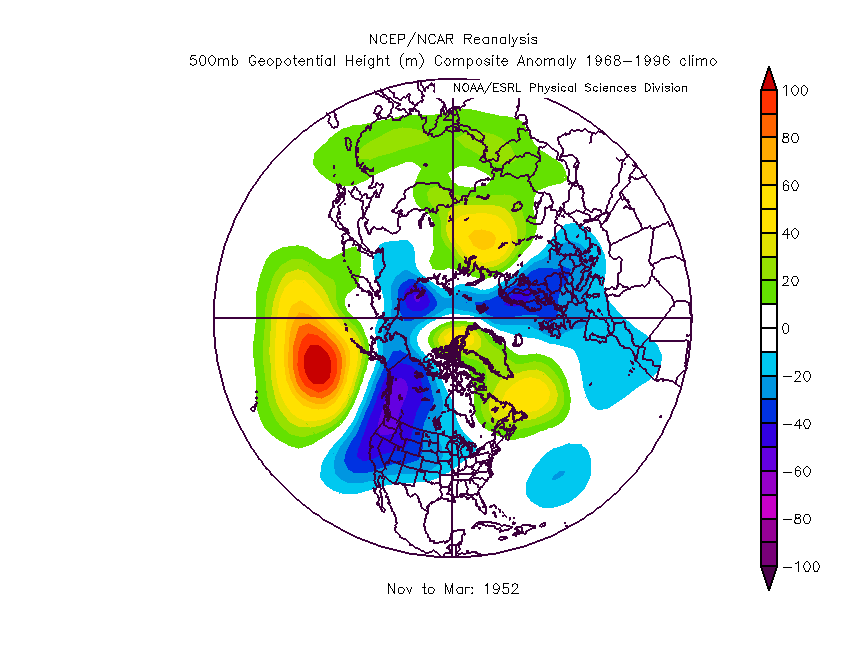
WE |
1951-1952 |
122 |
150 |
133 |
127 |
177 |
137 |
124 |
135 |
120 |
141 |
133 |
158 |
160 |
Precip |
500-hPa |
|
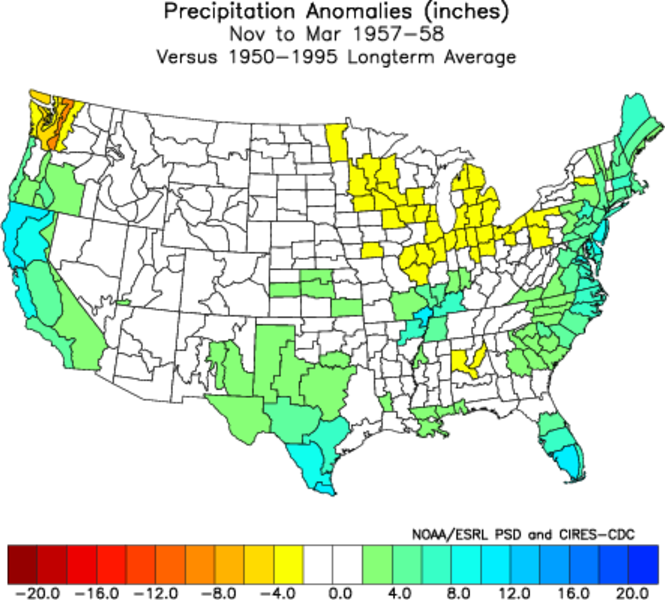
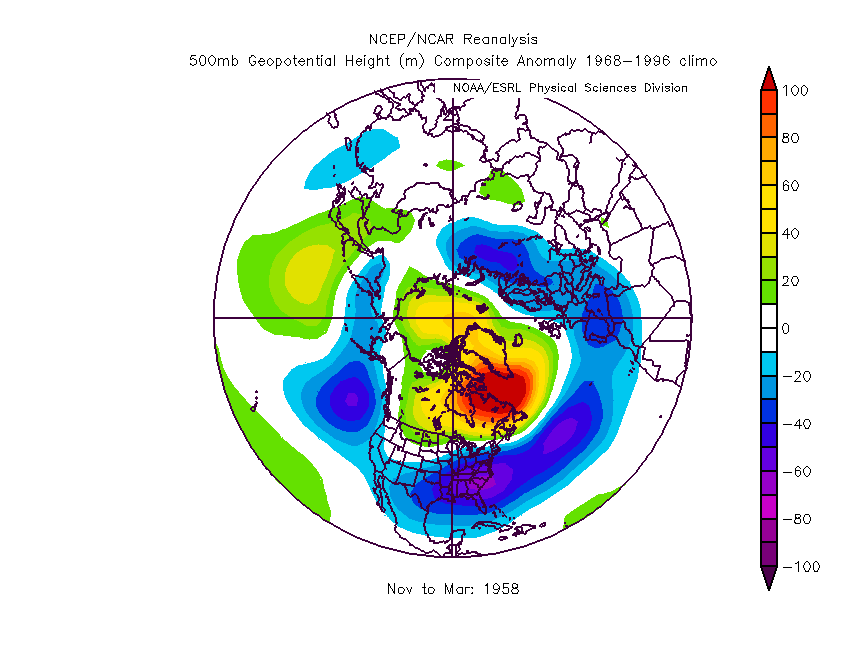
SE |
1957-1958 |
126 |
169 |
160 |
173 |
142 |
139 |
148 |
140 |
122 |
160 |
137 |
155 |
147 |
Precip |
500-hPa |
|
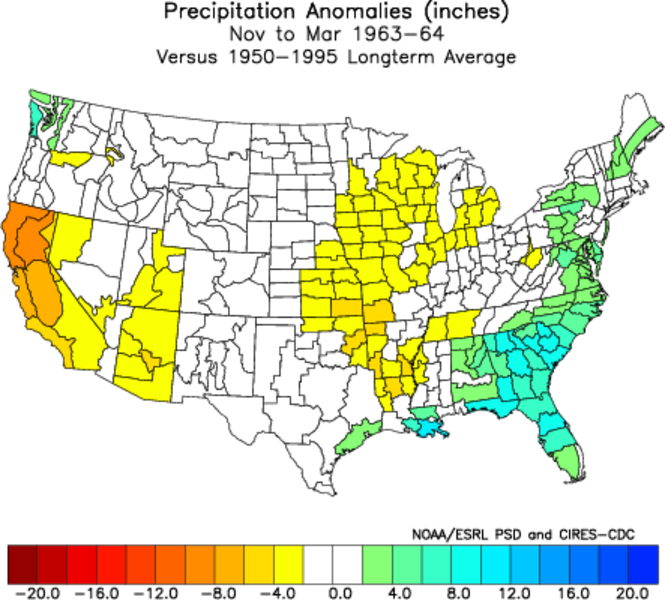
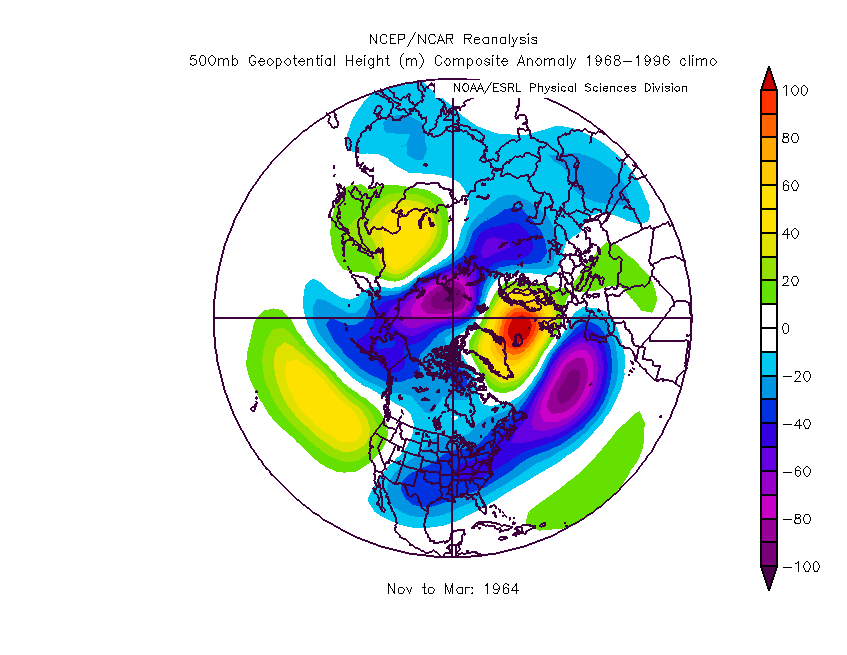
WE |
1963-1964 |
97 |
57 |
70 |
62 |
53 |
69 |
77 |
70 |
81 |
61 |
66 |
74 |
87 |
Precip |
500-hPa |
|
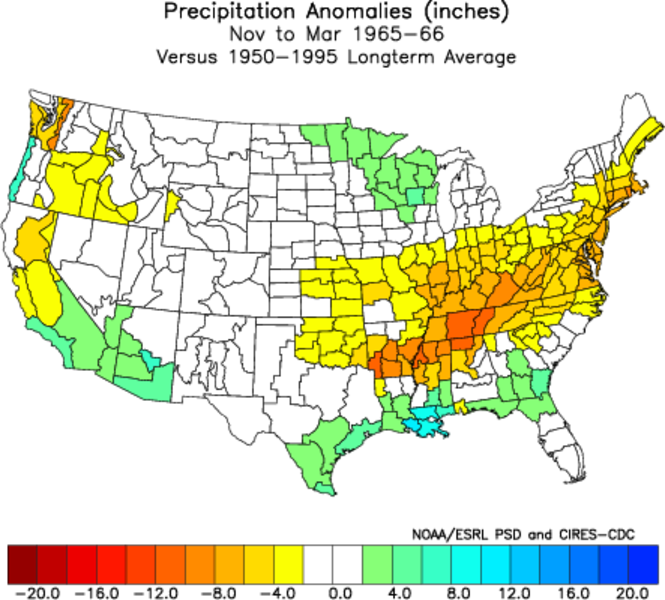
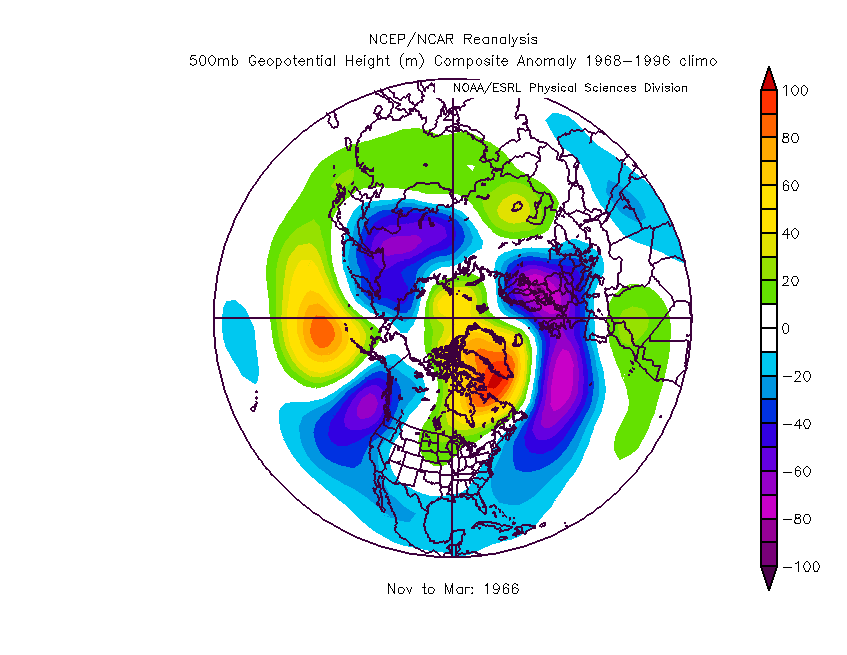
SE |
1965-1966 |
83 |
75 |
58 |
56 |
138 |
74 |
87 |
75 |
79 |
70 |
69 |
110 |
124 |
Precip |
500-hPa |
|
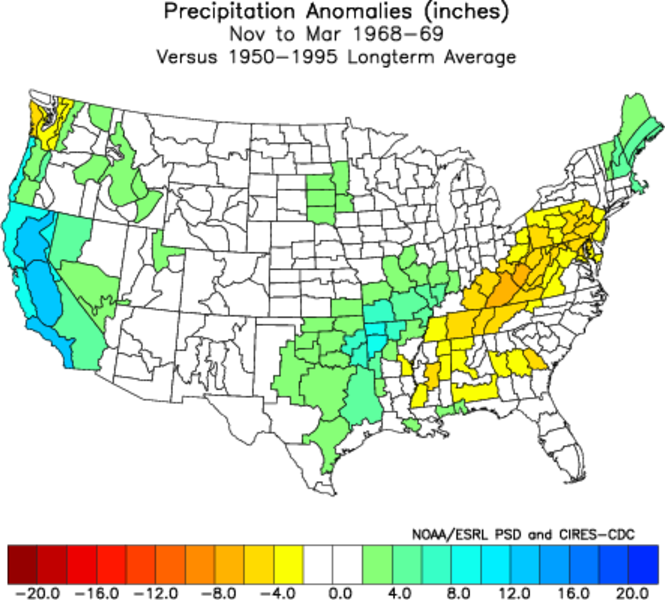
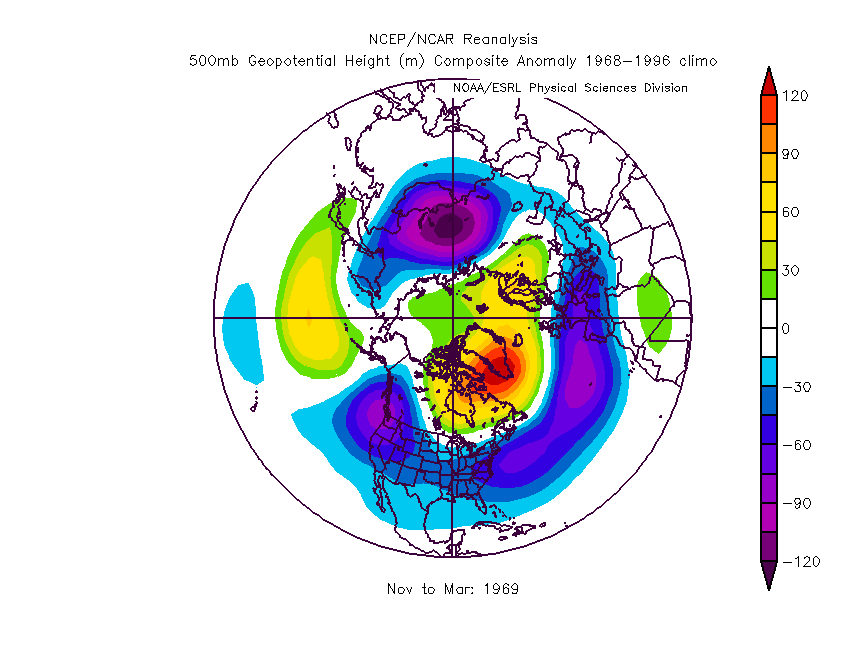
WE |
1968-1969 |
122 |
116 |
134 |
210 |
185 |
131 |
125 |
132 |
141 |
137 |
160 |
163 |
180 |
Precip |
500-hPa |
|
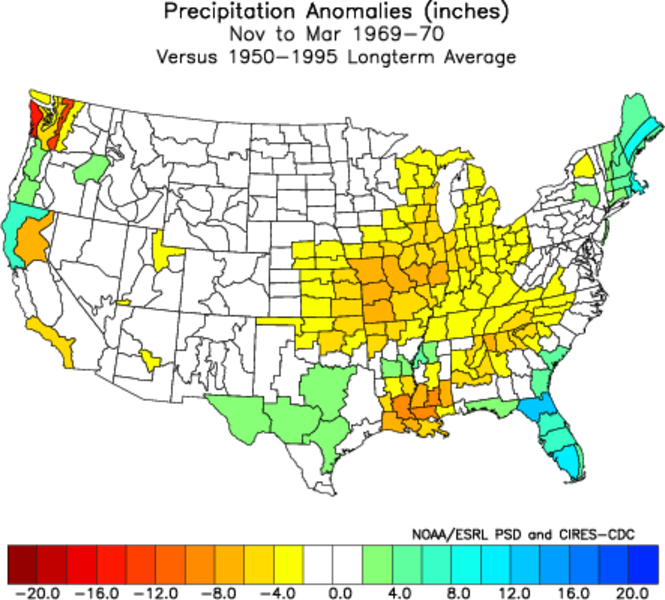
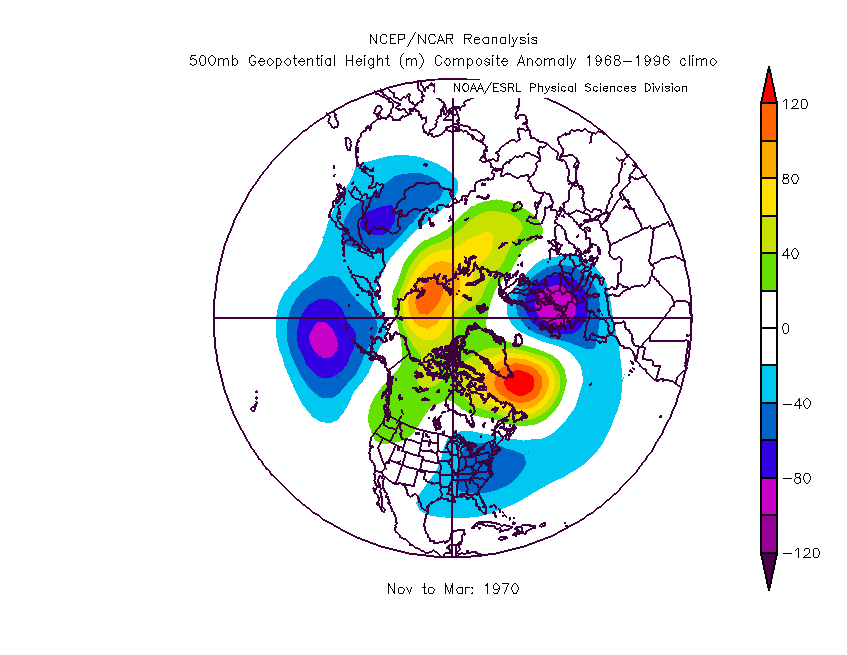
WE |
1969-1970 |
99 |
96 |
96 |
83 |
52 |
115 |
110 |
71 |
105 |
82 |
85 |
58 |
66 |
Precip |
500-hPa |
|
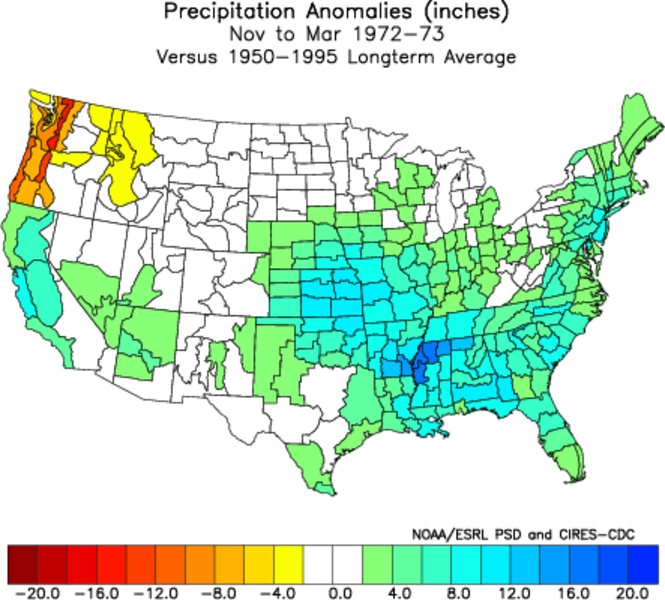
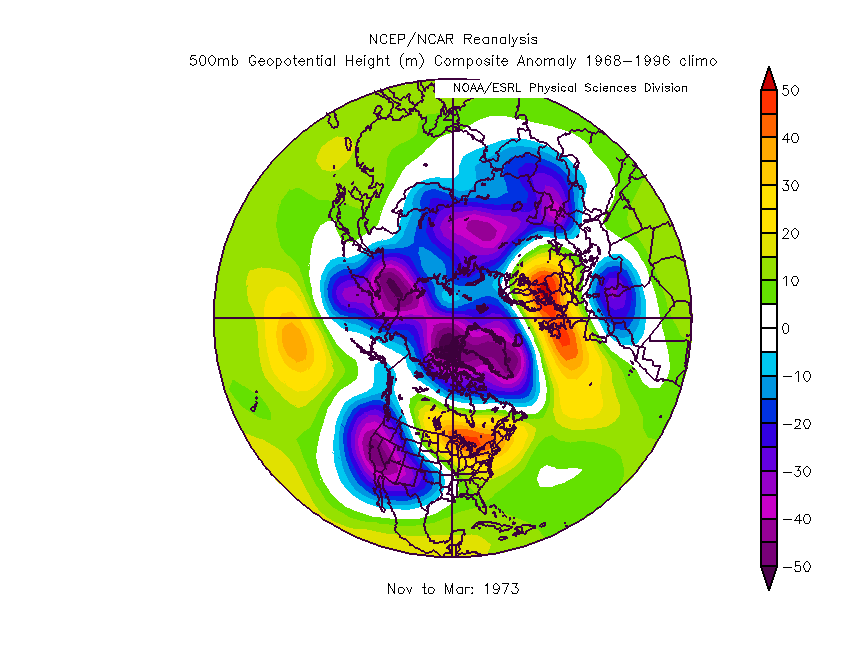
SE |
1972-1973 |
90 |
159 |
140 |
127 |
143 |
100 |
101 |
110 |
94 |
139 |
116 |
118 |
110 |
Precip |
500-hPa |
|
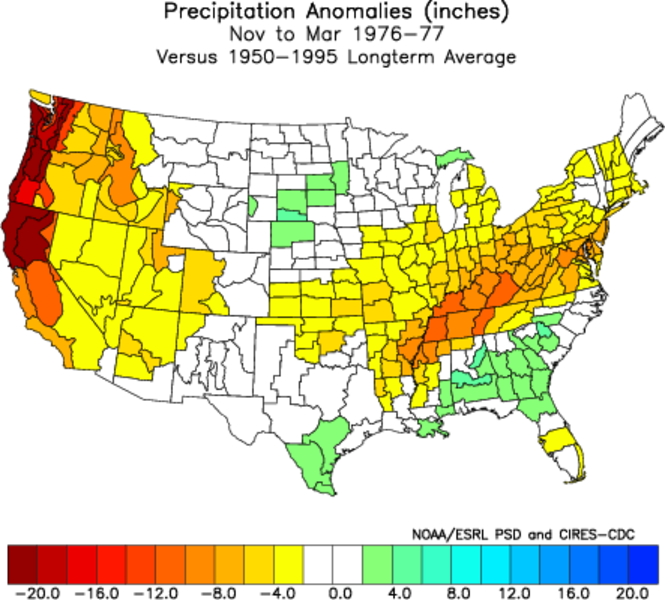
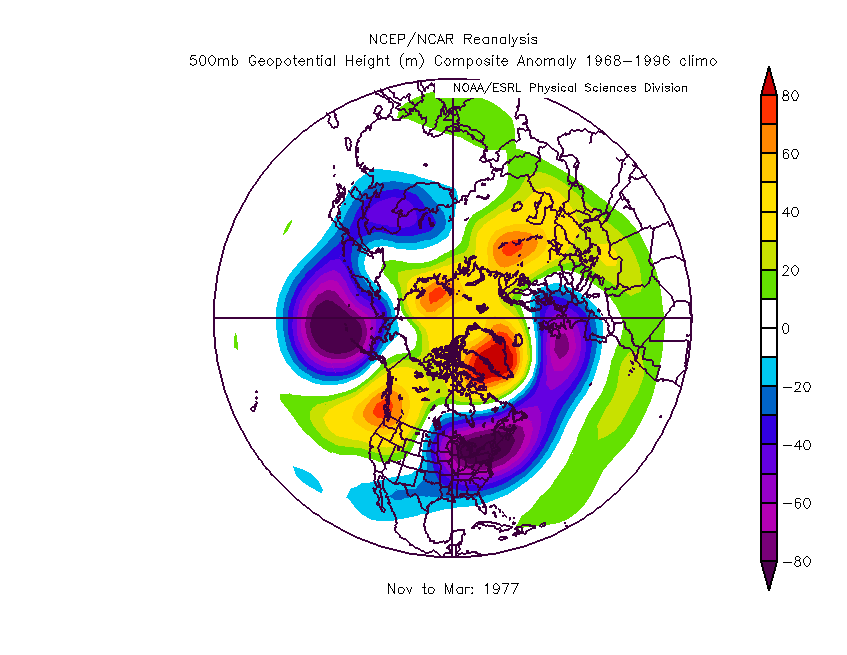
WE |
1976-1977 |
45 |
51 |
39 |
69 |
83 |
38 |
42 |
41 |
56 |
54 |
52 |
83 |
108 |
Precip |
500-hPa |
|
WE |
1977-1978 |
93 |
124 |
147 |
166 |
225 |
137 |
128 |
132 |
101 |
145 |
150 |
200 |
204 |
Precip |
500-hPa |
|
SE |
1982-1983 |
153 |
176 |
198 |
215 |
211 |
172 |
166 |
170 |
165 |
187 |
191 |
186 |
169 |
Precip |
500-hPa |
|
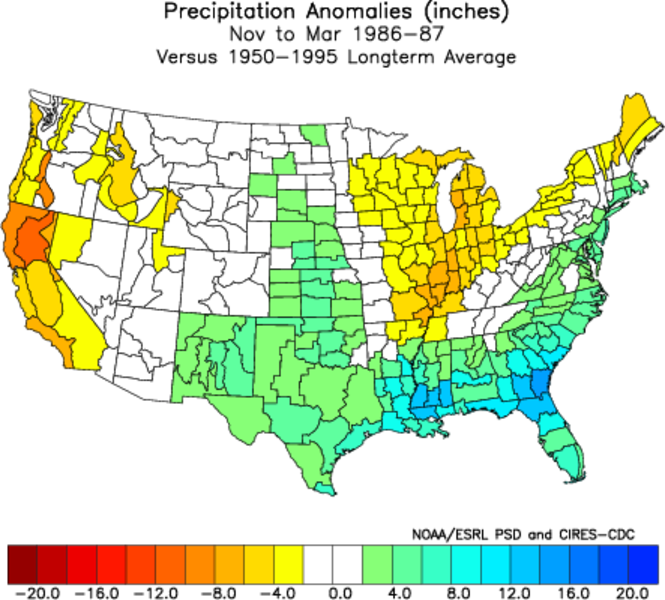
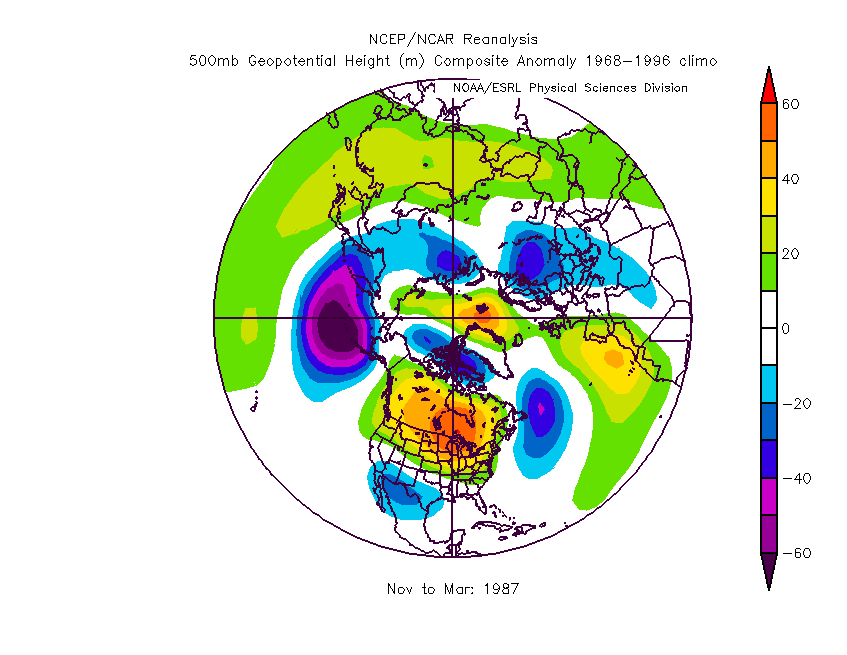
ME |
1986-1987 |
72 |
64 |
58 |
85 |
52 |
64 |
73 |
63 |
59 |
61 |
64 |
57 |
67 |
Precip |
500-hPa |
|
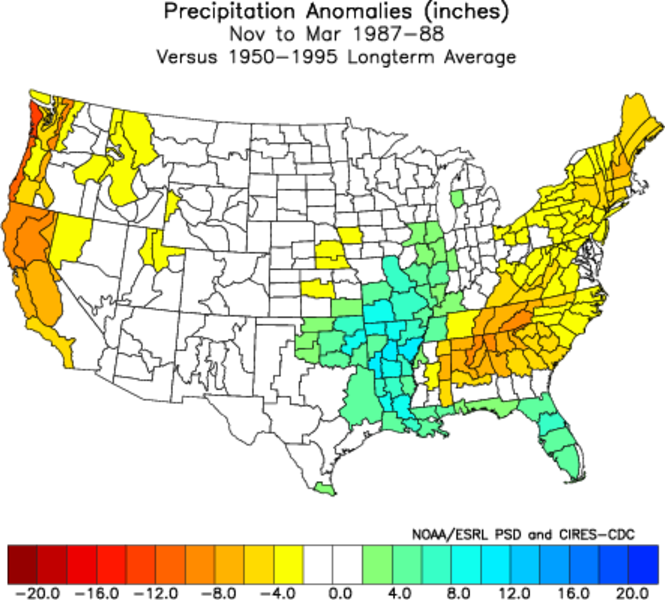
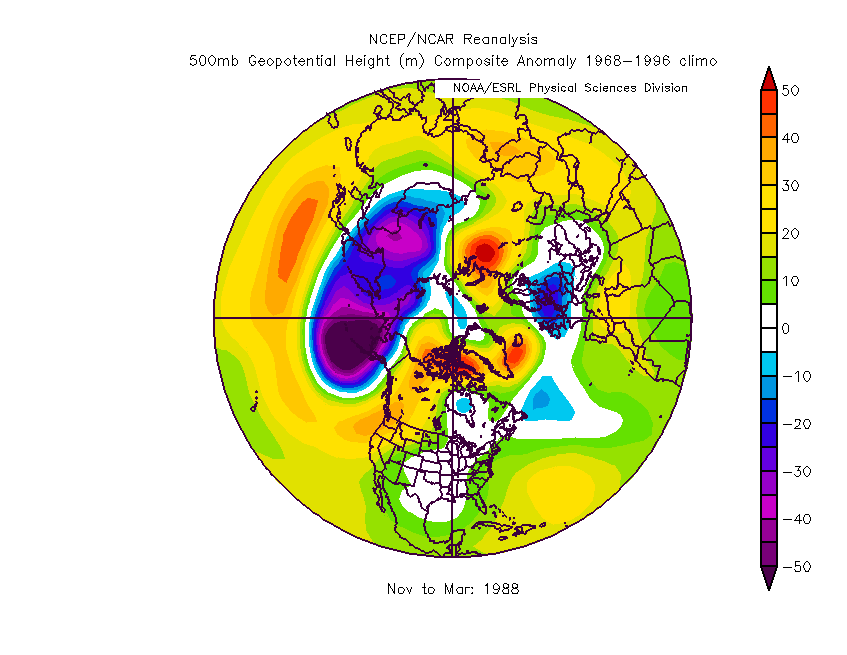
ME |
1987-1988 |
83 |
82 |
77 |
74 |
84 |
67 |
77 |
74 |
58 |
67 |
71 |
90 |
101 |
Precip |
500-hPa |
|
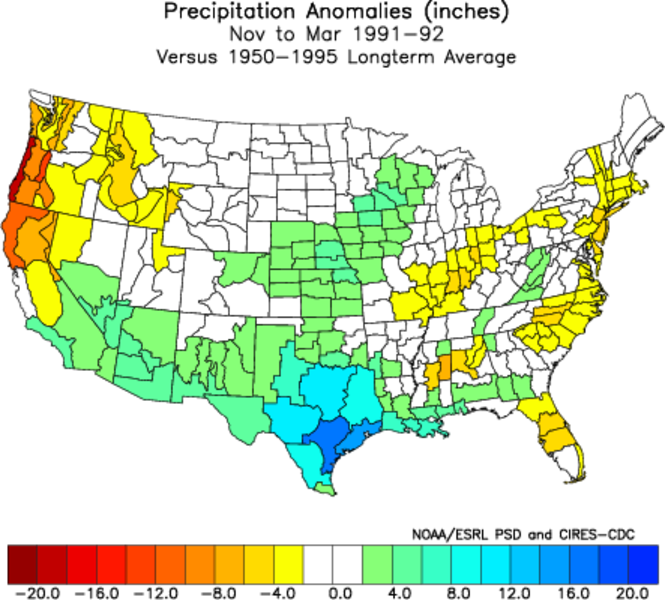
SE |
1991-1992 |
57 |
89 |
74 |
101 |
142 |
70 |
71 |
73 |
75 |
87 |
76 |
114 |
142 |
Precip |
500-hPa |
|
ME |
1994-1995 |
133 |
157 |
131 |
174 |
164 |
165 |
146 |
168 |
165 |
153 |
163 |
165 |
145 |
Precip |
500-hPa |
|
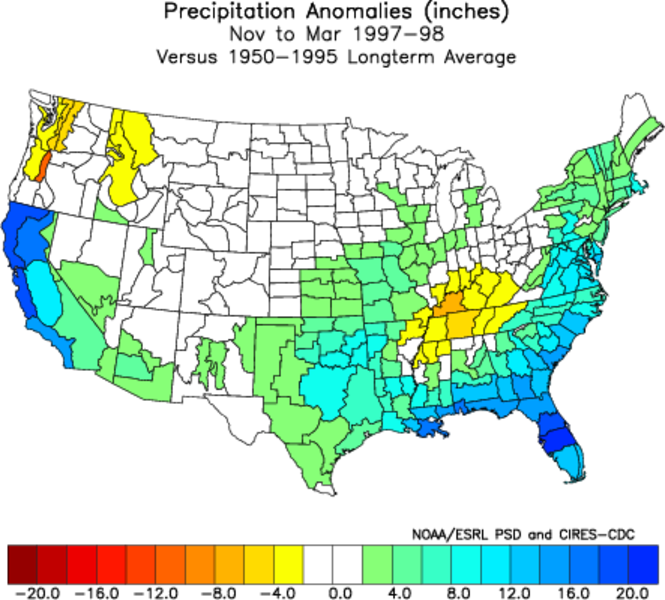
SE |
1997-1998 |
151 |
218 |
179 |
184 |
209 |
159 |
156 |
161 |
117 |
196 |
167 |
198 |
185 |
Precip |
500-hPa |
|
ME |
2002-2003 |
140 |
107 |
84 |
89 |
108 |
111 |
118 |
105 |
85 |
103 |
89 |
100 |
85 |
Precip |
500-hPa |
|
WE |
2004-2005 |
117 |
143 |
123 |
141 |
246 |
114 |
103 |
110 |
106 |
140 |
132 |
184 |
204 |
Precip |
500-hPa |
|
WE |
2006-2007 |
93 |
76 |
61 |
54 |
21 |
74 |
74 |
60 |
54 |
58 |
54 |
27 |
26 |
Precip |
500-hPa |
La Niña
Table 7. All La Niña Events - Average Percent of Normal Precipitation
(19 events)
|
ENSO Type |
Eureka |
San Francisco |
Sacramento |
Fresno |
Los Angeles |
8SI |
Div. 1 |
Div. 2 |
Div. 3 |
Div. 4 |
Div. 5 |
Div. 6 |
Div. 7 |
Anomaly Maps |
|
All La Niña |
101 |
90 |
89 |
86 |
80 |
96 |
98 |
93 |
94 |
87 |
85 |
70 |
72 |
Precip |
500-hPa |
|
Weak La Niña |
96 |
86 |
85 |
81 |
80 |
91 |
94 |
90 |
92 |
86 |
84 |
70 |
74 |
Precip |
500-hPa |
|
Moderate La Niña |
105 |
94 |
92 |
89 |
81 |
97 |
98 |
93 |
92 |
90 |
85 |
72 |
71 |
Precip |
500-hPa |
|
Strong La Niña |
109 |
93 |
94 |
93 |
78 |
107 |
108 |
99 |
99 |
88 |
86 |
68 |
67 |
Precip |
500-hPa |
Table 8. All La Niña - Years by Percent of Normal
Categories (19 events)
|
|
Eureka |
San Francisco |
Sacramento |
Fresno |
Los Angeles |
8SI |
Div. 1 |
Div. 2 |
Div. 3 |
Div. 4 |
Div. 5 |
Div. 6 |
Div. 7 |
| <80% |
2 |
6 |
7 |
9 |
8 |
7 |
5 |
7 |
7 |
7 |
10 |
16 |
15 |
| 80-100% |
7 |
5 |
6 |
6 |
7 |
3 |
5 |
4 |
3 |
6 |
5 |
3 |
3 |
|
100-120% |
7 |
6 |
4 |
3 |
3 |
4 |
7 |
5 |
6 |
5 |
3 |
0 |
1 |
|
120-140% |
3 |
2 |
1 |
1 |
1 |
3 |
1 |
3 |
3 |
1 |
1 |
0 |
0 |
| >140% |
0 |
0 |
1 |
0 |
0 |
2 |
1 |
0 |
0 |
0 |
0 |
0 |
0 |
Table 9. Weak La Niña - Years by Percent of Normal
Categories (9 events)
|
|
Eureka |
San Francisco |
Sacramento |
Fresno |
Los Angeles |
8SI |
Div. 1 |
Div. 2 |
Div. 3 |
Div. 4 |
Div. 5 |
Div. 6 |
Div. 7 |
| <80% |
2 |
3 |
4 |
5 |
4 |
4 |
2 |
4 |
4 |
4 |
5 |
7 |
6 |
| 80-100% |
2 |
3 |
3 |
3 |
3 |
2 |
3 |
2 |
2 |
2 |
2 |
2 |
2 |
|
100-120% |
5 |
3 |
1 |
1 |
1 |
1 |
4 |
2 |
1 |
3 |
2 |
0 |
1 |
|
120-140% |
0 |
0 |
1 |
0 |
1 |
2 |
0 |
1 |
2 |
0 |
0 |
0 |
0 |
| >140% |
0 |
0 |
0 |
0 |
0 |
0 |
0 |
0 |
0 |
0 |
0 |
0 |
0 |
Table 10. Moderate La Niña - Years by Percent of Normal
Categories (6 events)
|
|
Eureka |
San Francisco |
Sacramento |
Fresno |
Los Angeles |
8SI |
Div. 1 |
Div. 2 |
Div. 3 |
Div. 4 |
Div. 5 |
Div. 6 |
Div. 7 |
| <80% |
0 |
2 |
2 |
3 |
2 |
2 |
2 |
2 |
2 |
1 |
3 |
6 |
5 |
| 80-100% |
3 |
1 |
2 |
1 |
4 |
0 |
1 |
1 |
1 |
4 |
2 |
0 |
1 |
|
100-120% |
1 |
3 |
2 |
2 |
0 |
3 |
3 |
3 |
3 |
1 |
1 |
0 |
0 |
|
120-140% |
2 |
0 |
0 |
0 |
0 |
1 |
0 |
0 |
0 |
0 |
0 |
0 |
0 |
| >140% |
0 |
0 |
0 |
0 |
0 |
0 |
0 |
0 |
0 |
0 |
0 |
0 |
0 |
Table 11. Strong La Niña - Years by Percent of Normal
Categories (4 events)
|
|
Eureka |
San Francisco |
Sacramento |
Fresno |
Los Angeles |
8SI |
Div. 1 |
Div. 2 |
Div. 3 |
Div. 4 |
Div. 5 |
Div. 6 |
Div. 7 |
| <80% |
0 |
1 |
1 |
1 |
2 |
1 |
1 |
1 |
1 |
2 |
2 |
3 |
4 |
| 80-100% |
2 |
1 |
1 |
2 |
0 |
1 |
1 |
1 |
0 |
0 |
1 |
1 |
0 |
|
100-120% |
1 |
0 |
1 |
0 |
2 |
0 |
0 |
0 |
2 |
1 |
0 |
0 |
0 |
|
120-140% |
1 |
2 |
0 |
1 |
0 |
0 |
1 |
2 |
1 |
1 |
1 |
0 |
0 |
| >140% |
0 |
0 |
1 |
0 |
0 |
2 |
1 |
0 |
0 |
0 |
0 |
0 |
0 |
Table 12. All La Niña Events - Individual Years Percent of Normal
Precipitation (19 events)
|
ENSO Type |
Season |
Eureka |
San Francisco |
Sacramento |
Fresno |
Los Angeles |
8SI |
Div. 1 |
Div. 2 |
Div. 3 |
Div. 4 |
Div. 5 |
Div. 6 |
Div. 7 |
Anomaly Maps |
|
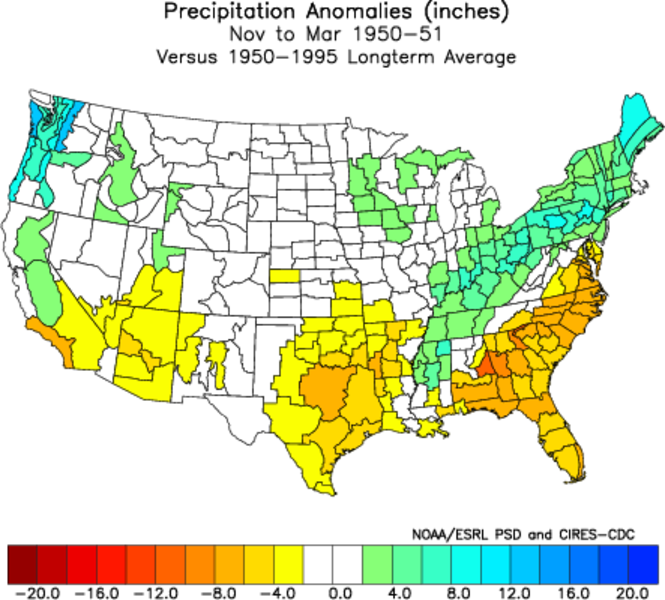
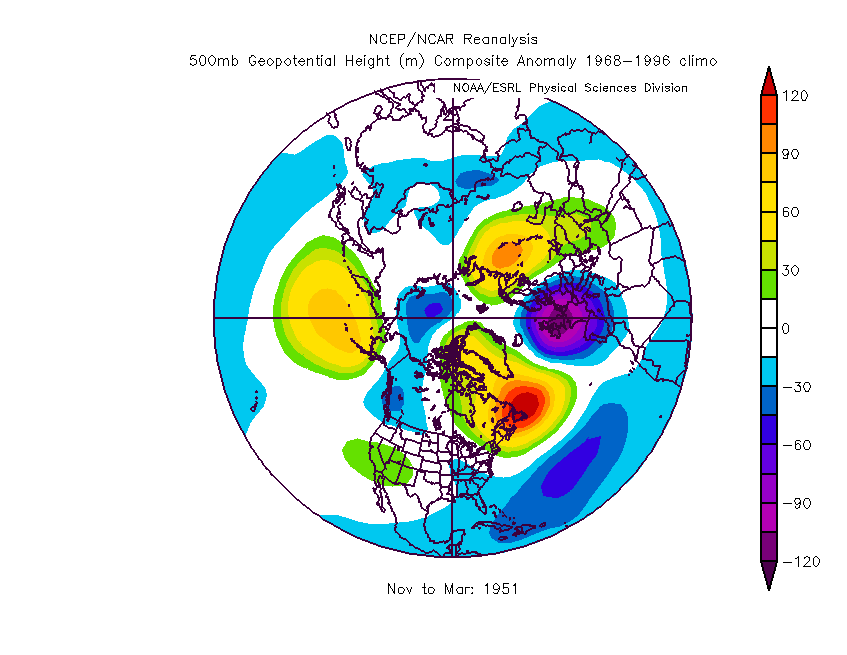
WL |
1950-1951 |
117 |
108 |
98 |
94 |
54 |
122 |
117 |
116 |
102 |
101 |
111 |
56 |
48 |
Precip |
500-hPa |
|
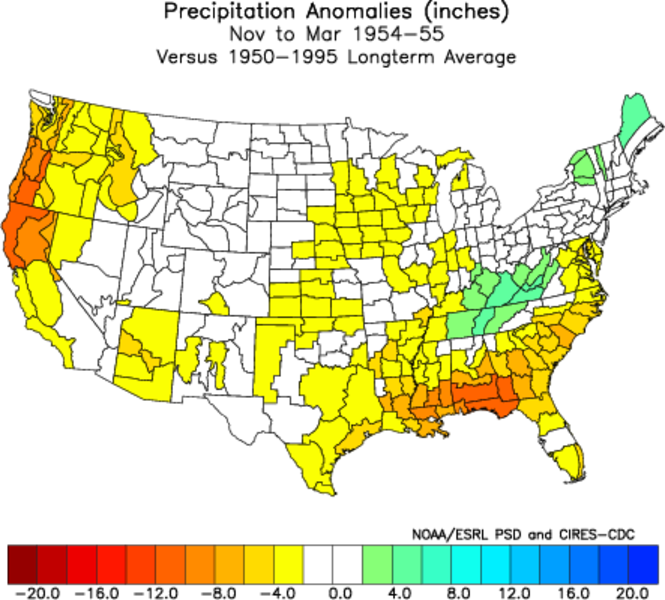
ML |
1954-1955 |
86 |
73 |
83 |
94 |
81 |
70 |
73 |
70 |
59 |
76 |
77 |
74 |
76 |
Precip |
500-hPa |
|
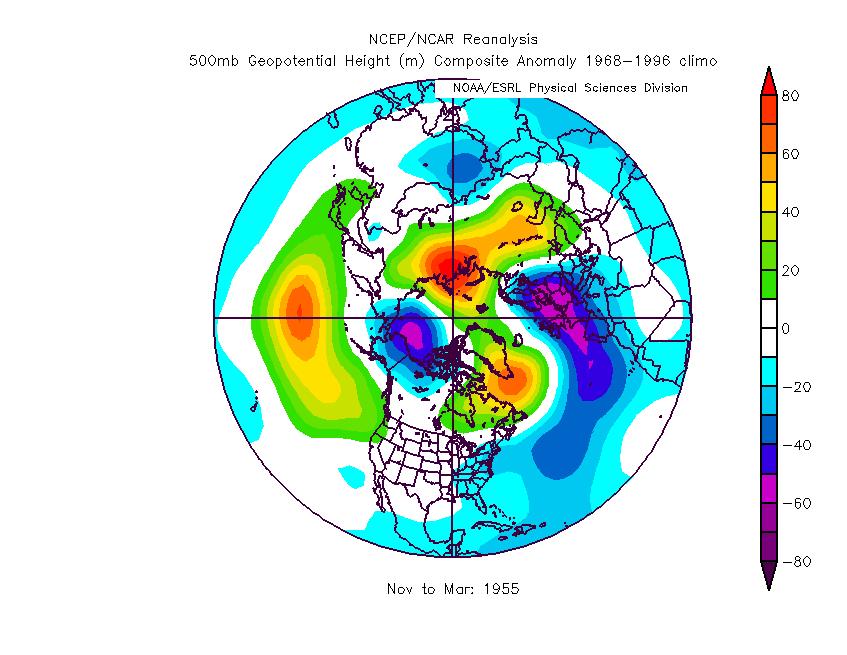
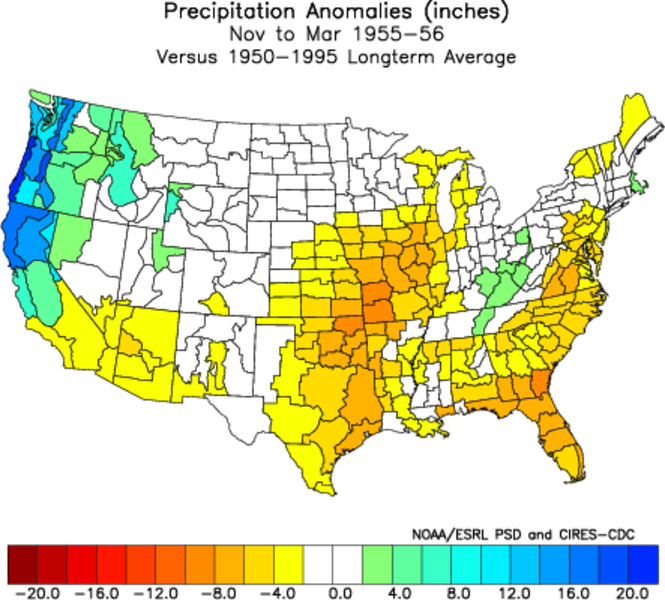
SL |
1955-1956 |
120 |
126 |
142 |
122 |
108 |
141 |
133 |
133 |
140 |
127 |
122 |
81 |
74 |
Precip |
500-hPa |
|
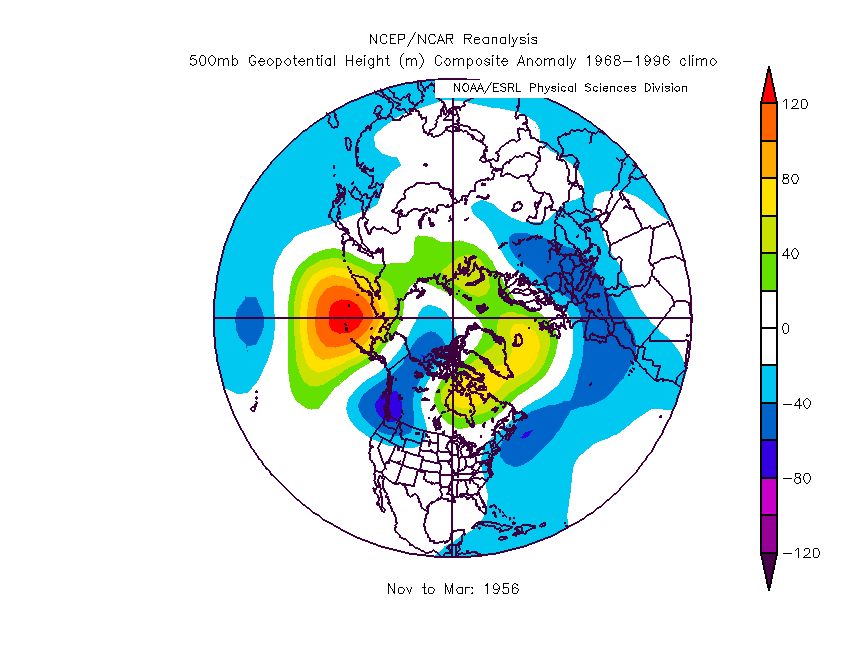
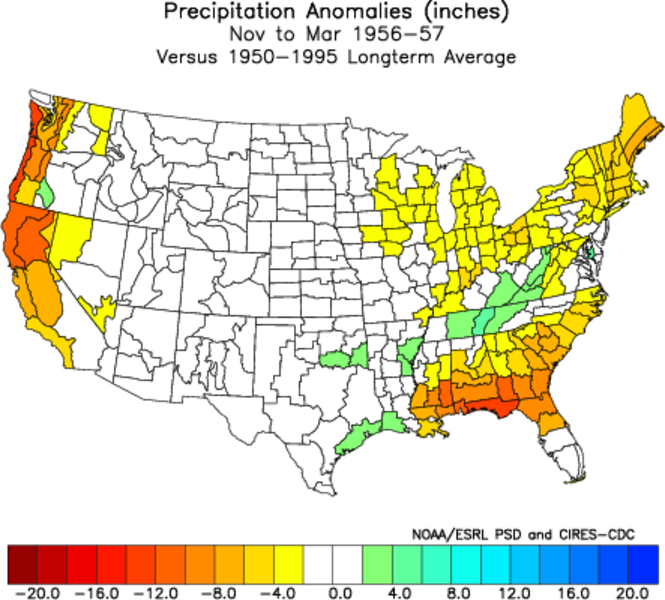
WL |
1956-1957 |
94 |
69 |
77 |
75 |
64 |
86 |
84 |
81 |
89 |
76 |
77 |
75 |
76 |
Precip |
500-hPa |
|
WL |
1962-1963 |
113 |
102 |
140 |
106 |
57 |
123 |
116 |
125 |
135 |
117 |
99 |
55 |
62 |
Precip |
500-hPa |
|
ML |
1964-1965 |
105 |
103 |
102 |
102 |
92 |
121 |
113 |
118 |
119 |
95 |
105 |
80 |
81 |
Precip |
500-hPa |
|
WL |
1967-1968 |
73 |
67 |
66 |
66 |
112 |
74 |
79 |
75 |
78 |
66 |
64 |
76 |
96 |
Precip |
500-hPa |
|
ML |
1970-1971 |
124 |
87 |
91 |
78 |
83 |
108 |
119 |
101 |
108 |
85 |
82 |
75 |
76 |
Precip |
500-hPa |
|
WL |
1971-1972 |
102 |
51 |
52 |
49 |
48 |
68 |
92 |
63 |
80 |
47 |
53 |
49 |
68 |
Precip |
500-hPa |
|
SL |
1973-1974 |
137 |
128 |
115 |
95 |
101 |
148 |
152 |
130 |
105 |
119 |
99 |
79 |
70 |
Precip |
500-hPa |
|
WL |
1974-1975 |
103 |
84 |
88 |
70 |
97 |
97 |
105 |
96 |
98 |
86 |
91 |
89 |
71 |
Precip |
500-hPa |
|
SL |
1975-1976 |
87 |
37 |
37 |
75 |
49 |
50 |
65 |
45 |
52 |
39 |
53 |
59 |
70 |
Precip |
500-hPa |
|
WL |
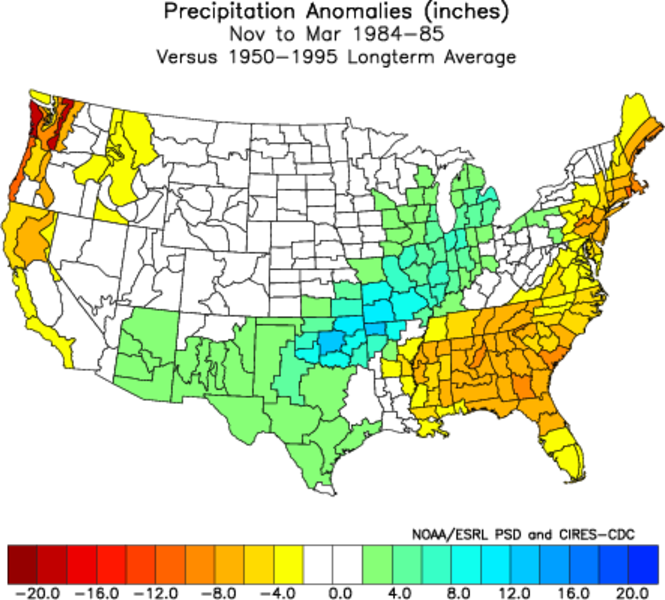
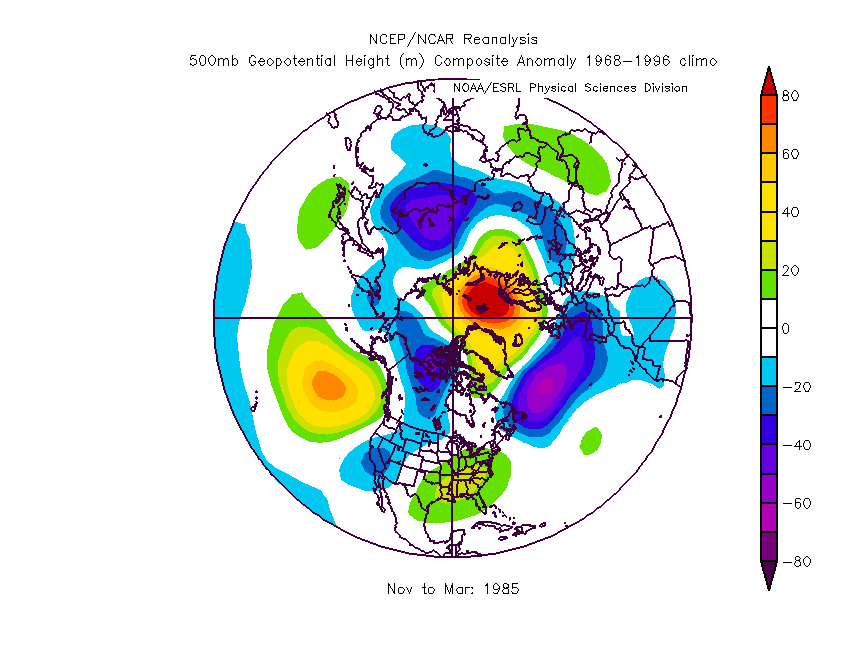
1984-1985 |
91 |
92 |
59 |
72 |
86 |
68 |
81 |
70 |
77 |
79 |
78 |
77 |
115 |
Precip |
500-hPa |
|
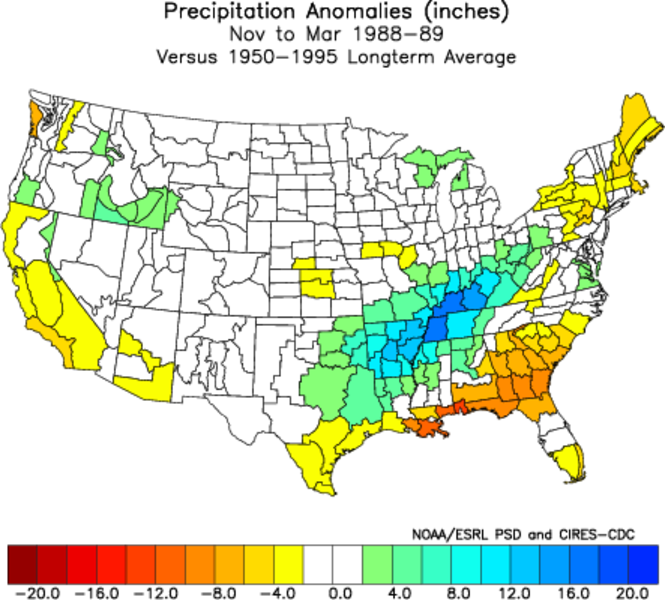
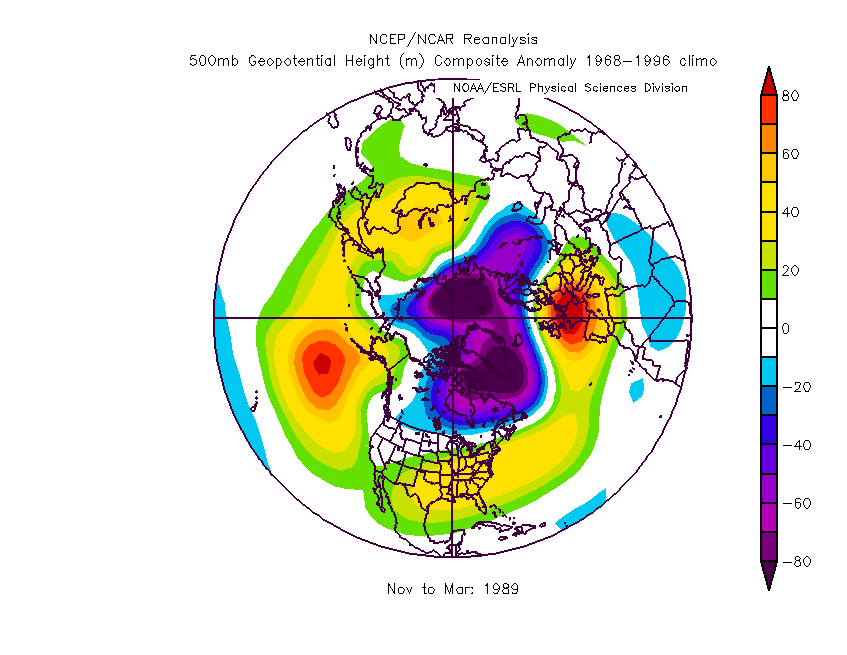
SL |
1988-1989 |
90 |
81 |
80 |
80 |
54 |
89 |
84 |
88 |
101 |
67 |
70 |
55 |
55 |
Precip |
500-hPa |
|
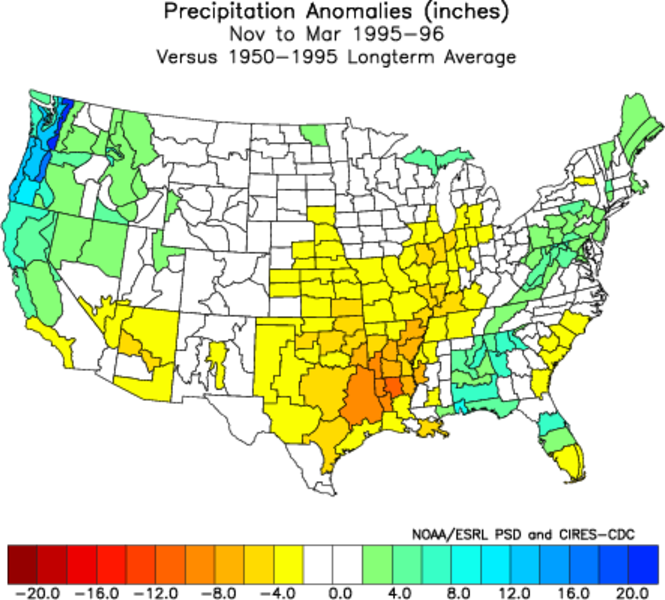
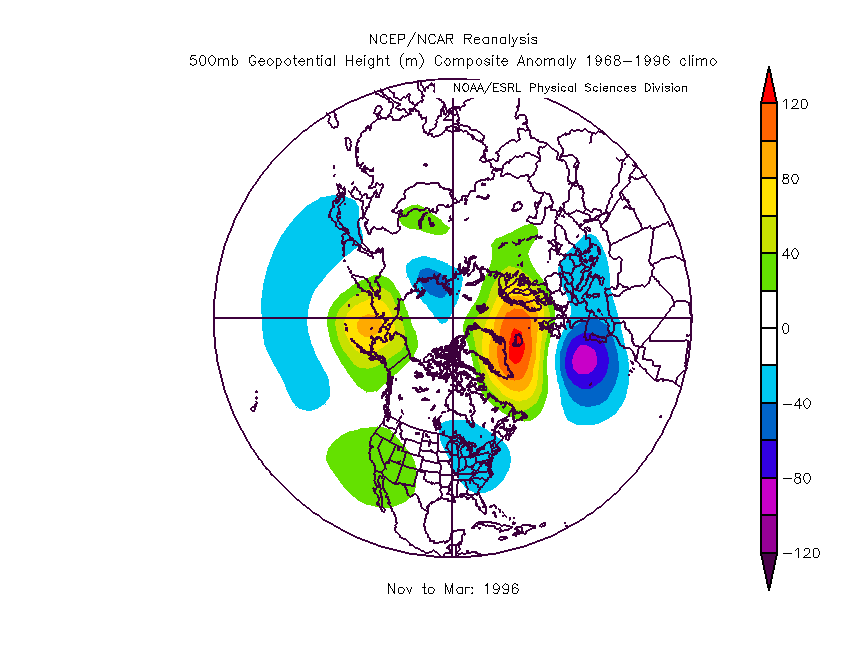
WL |
1995-1996 |
115 |
115 |
105 |
99 |
84 |
116 |
117 |
114 |
123 |
113 |
106 |
67 |
53 |
Precip |
500-hPa |
|
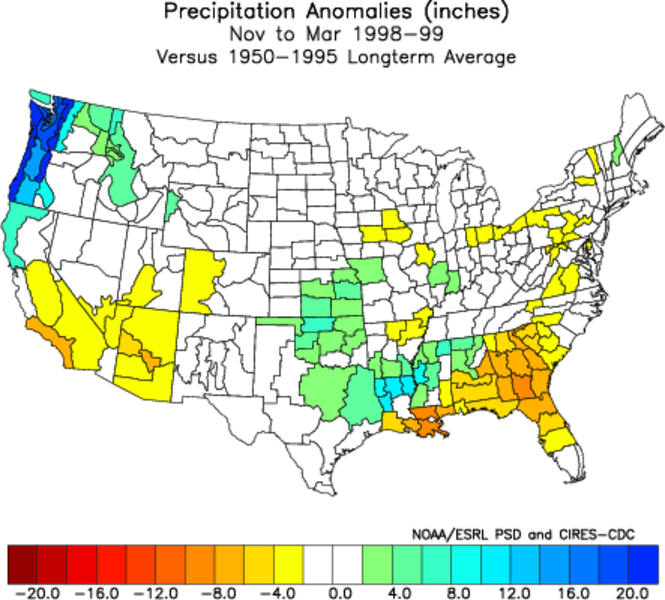
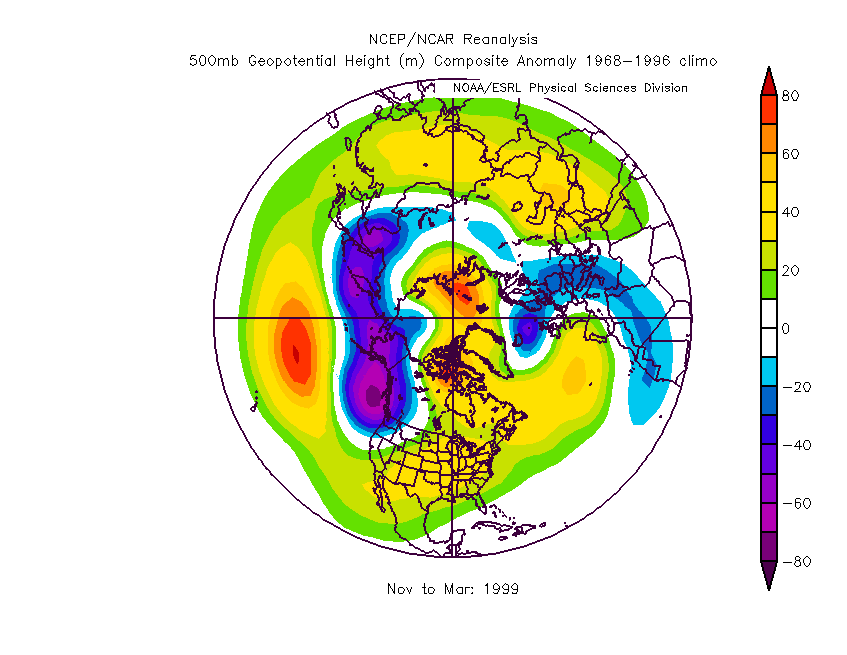
ML |
1998-1999 |
129 |
109 |
78 |
64 |
61 |
107 |
109 |
95 |
103 |
91 |
80 |
56 |
56 |
Precip |
500-hPa |
|
ML |
1999-2000 |
94 |
115 |
120 |
118 |
78 |
107 |
93 |
101 |
87 |
111 |
96 |
67 |
65 |
Precip |
500-hPa |
|
WL |
2000-2001 |
59 |
90 |
83 |
96 |
121 |
65 |
60 |
66 |
50 |
86 |
77 |
89 |
80 |
Precip |
500-hPa |
|
ML |
2007-2008 |
89 |
79 |
76 |
75 |
89 |
70 |
79 |
71 |
76 |
82 |
69 |
78 |
74 |
Precip |
500-hPa |
Copyright © 2009,
Golden
Gate Weather Services.
Reproduction in full or part is prohibited without permission
| 