California Precipitation Climatology for
Cool Neutral and Weak La Niña Events

by Jan Null, CCM
Updated August 2016


 Summary:   With the SST forecasts trending toward a minimal La Niña at best the following is a breakdown of the California precipitation climatology of cool neutral winters compared to those whch barely cross the threshold into the weak La Niña category.


Overview:  
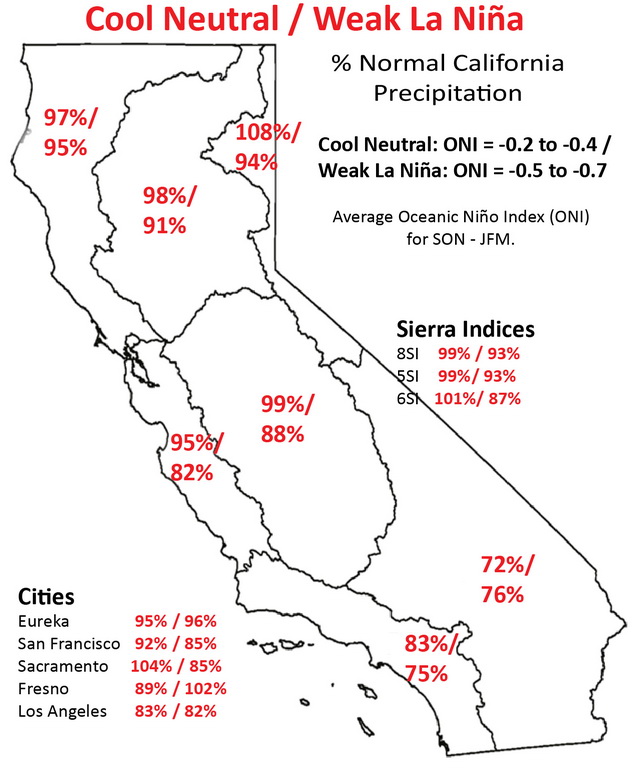
The criteria for a La Niña event is when the Oceanic Niño Index (ONI) cools to  -0.5 or less for five consecutive overlapping 3-month "seasons". For this analysis I have limited the period used to the rainiest months in California (i.e., Sept-Oct-Nov through Jan-Feb-Mar). There were 8 seasons that were in the -0.2 to -0.4 ONI "cool" category and 10 seasons in which the ONI ranged from -0.5 to -0.7 as weak "La Niñas".

Seasonal (July 1 through June 30) percent of normal precipitation for each category, was collated for a number of cities and geographic areas. These include the seven NCDC climate divisions (map) plus the entire state of California (CA), the 
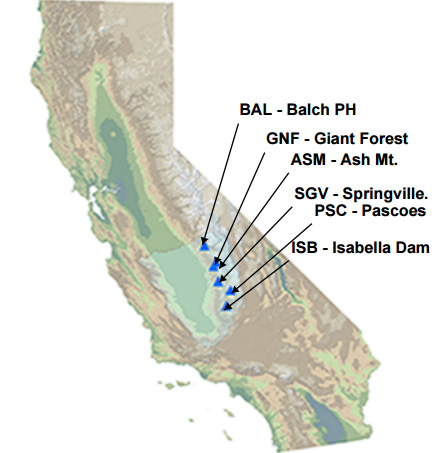
three major watershed areas [i.e., the Northern Sierra Nevada Eight Station Index (8SI, map), the Southern Sierra Nevada Five Station Index (5SI, map) and the Tulare Basin Six Station Index (6SI, map)] plus five major cities.


Observations:  The average "signals" associated with both the cool neutral seasons and weak La Niña events are wetter in the Northern and Central California. And it should be noted that the middle third of the state sees a larger ranger between the cool neutral season and weak La Niña seasons.  Central California also showed a broader range between the wettest and driest seasons within each category.


Very Important Caveat:  The data presented here is a climatology of past events and is made up of a broad range of events from a small relatively sample that are averaged together.  Consequently, like any climatology, this type of data should not be used as a forecast but rather a context for possible future events. 


Percent of Normal Precipiation

Table 1.  Average Percent of Normal Seasonal Precipitation Ranked by ONI
ONI Div. 1 Div. 2 Div. 3 Div. 4 Div. 5 Div. 6 Div. 7 CA 8SI 5SI 6SI SF EKA SAC FAT LAX
-0.2 to -0.4 Avg.  97% 98% 108% 95% 99% 83% 72% 95% 99% 99% 101% 92% 95% 104% 92% 83%
  Min 55% 57% 65% 44% 47% 35% 32% 54% 56% 46% 48% 53% 52% 53% 42% 30%
  Max 118% 125% 138% 134% 136% 128% 110% 121% 130% 136% 161% 124% 125% 142% 130% 147%
-0.5 to -0.7 Avg.  95% 91% 94% 82% 88% 75% 76% 89% 93% 93% 87% 85% 96% 85% 80% 82%
  Min 59% 66% 58% 48% 56% 50% 49% 69% 62% 57% 53% 47% 57% 50% 46% 48%
  Max 138% 140% 133% 120% 125% 99% 95% 127% 148% 132% 117% 146% 146% 127% 127% 120%


Table 2.  Percent of Normal Precipitation Ranked by ONI  (-0.2 through -0.7)
  Normal (in.) 49.96 36.98 20.75 22.21 20.99 18.03 6.37 23.18 54.52 42.57 30.50 23.65 40.33 18.52 11.50 14.93
Avg. ONI Season 1 2 3 4 5 6 7 CAL 8SI 5SI 6SI SF EKA SAC FAT LAX
-0.2 1961-1962 81% 85% 98% 96% 100% 119% 89% 91% 83% 95% 95% 75% 72% 94% 99% 126%
-0.2 2001-2002 93% 86% 75% 72% 76% 35% 32% 77% 86% 79% 82% 106% 101% 97% 61% 30%
-0.3 1966-1967 109% 122% 138% 134% 136% 128% 89% 120% 115% 132% 161% 124% 110% 142% 130% 147%
-0.3 1962-1963 116% 115% 129% 109% 103% 61% 58% 105% 117% 103% 97% 94% 109% 136% 101% 56%
-0.3 1956-1957 89% 81% 91% 74% 78% 76% 65% 81% 82% 76% 74% 64% 91% 74% 71% 64%
-0.3 1985-1986 114% 125% 137% 121% 131% 115% 110% 121% 130% 136% 140% 121% 97% 128% 129% 120%
-0.4 2013-2014 55% 57% 65% 44% 47% 42% 63% 54% 56% 46% 48% 53% 52% 53% 42% 41%
-0.4 1996-1997 118% 115% 133% 111% 118% 86% 66% 111% 125% 127% 112% 96% 125% 107% 104% 83%
-0.5 2005-2006 138% 140% 133% 120% 125% 92% 83% 127% 148% 132% 117% 146% 146% 127% 127% 88%
-0.6 1967-1968 79% 76% 77% 62% 66% 76% 95% 76% 70% 57% 59% 61% 70% 64% 63% 111%
-0.6 1954-1955 68% 68% 61% 79% 76% 78% 71% 71% 67% 66% 76% 67% 83% 81% 89% 80%
-0.6 1974-1975 103% 92% 100% 91% 93% 92% 74% 94% 92% 103% 94% 77% 99% 86% 67% 96%
-0.6 1983-1984 111% 107% 118% 77% 93% 63% 88% 99% 109% 107% 94% 95% 120% 78% 66% 70%
-0.6 2008-2009 69% 77% 75% 70% 75% 67% 78% 74% 86% 92% 84% 77% 74% 88% 68% 61%
-0.6 1964-1965 116% 112% 118% 96% 107% 81% 69% 106% 116% 121% 102% 94% 101% 99% 97% 92%
-0.7 1950-1951 111% 108% 116% 86% 105% 56% 62% 100% 117% 116% 117% 101% 115% 95% 90% 55%
-0.7 1971-1972 92% 67% 81% 48% 56% 50% 49% 69% 65% 66% 53% 47% 98% 50% 46% 48%
-0.7 2000-2001 59% 66% 58% 89% 80% 99% 93% 72% 62% 69% 74% 82% 57% 81% 92% 120%


Copyright © 2016, Golden Gate Weather Services
Reproduction in full or part is prohibited without permission