|
El Niño & La Niña
Misconceptions |
 |
|
|
||||||||||||||||||||||||||||||||||||||||||||||||||||||||||||||||||||||||||||||||||||||||||||||||||||||||||||||||||||||||||||||||||||||||||||||||||||||||||||||||||||||||||||||||||||
|
1. El Niño or La Niña will soon arrive
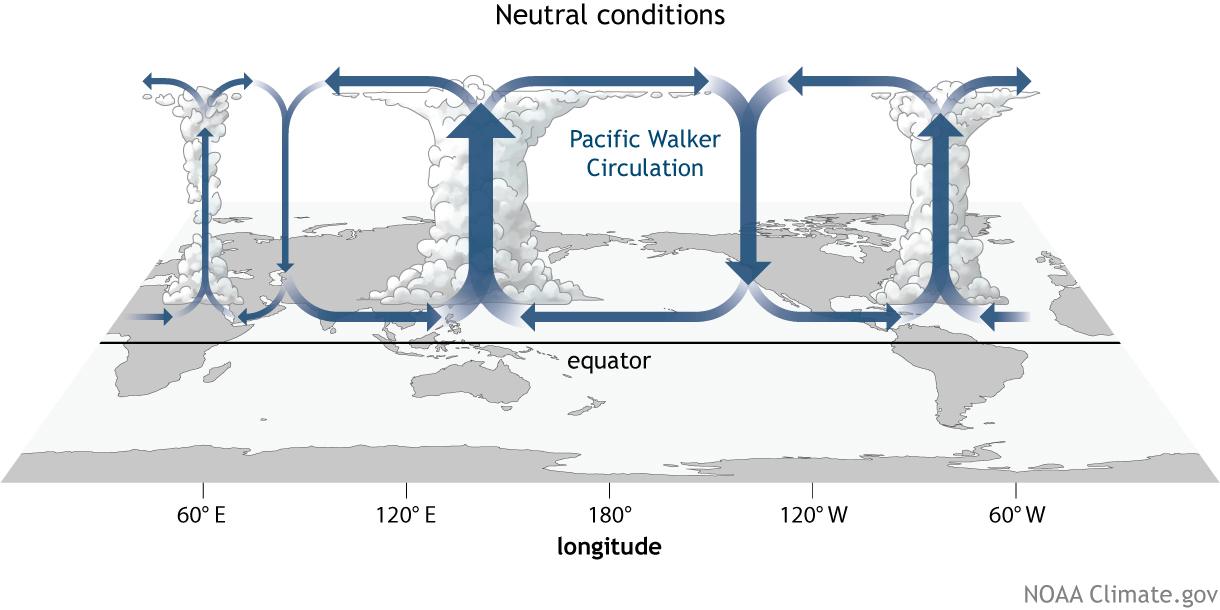
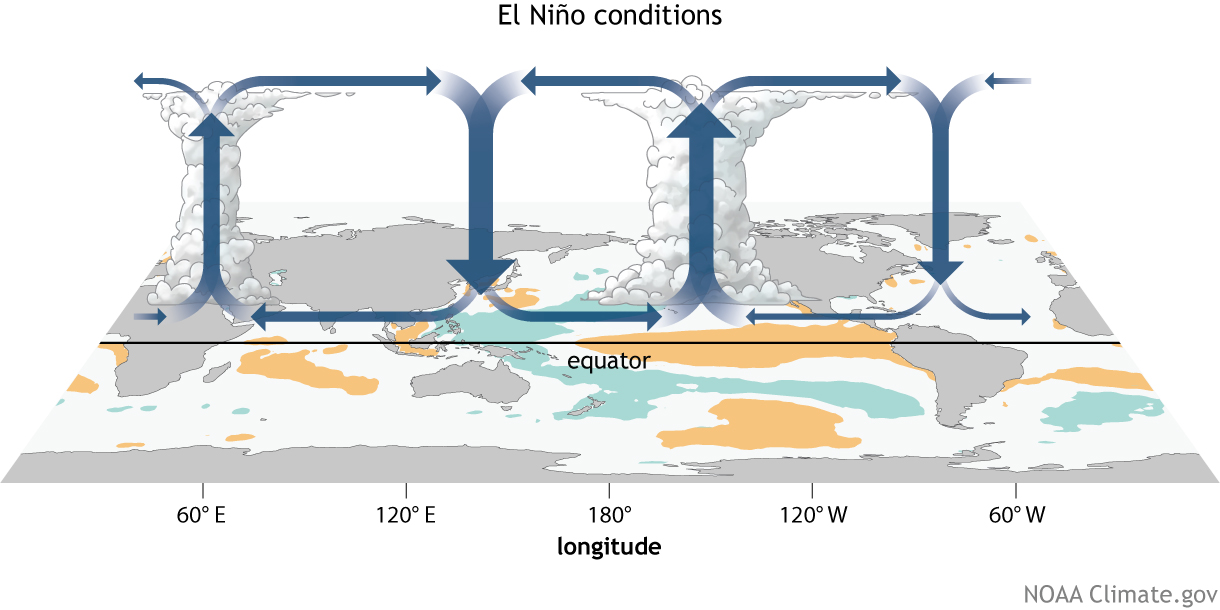
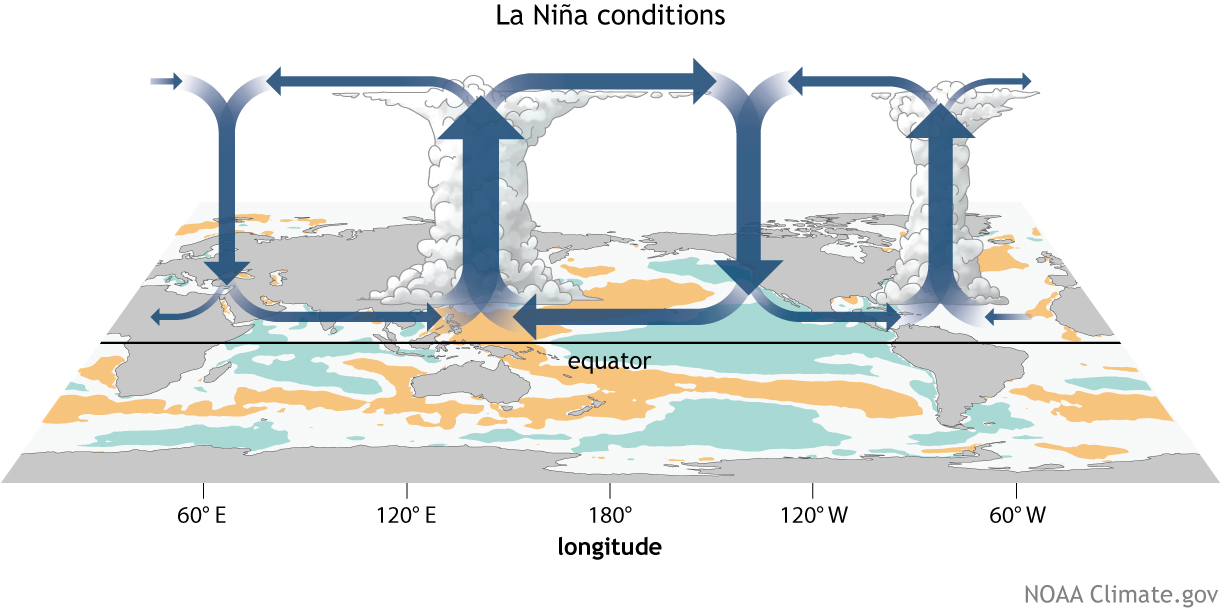
in California No -- Neither ever comes to North America. Rather, they are phenomena that periodically occurs in the warm equatorial waters of the Pacific Ocean. Normally the trade winds along the equator push the warmest waters into the western portions of the Pacific. But on an irregular basis of typically two to five years, the trades slacken, or sometimes even reverse direction, and warmer-than-normal water accumulates along the equator in the central and eastern Pacific. This warming is called El Niño, referring to the “Christ child'' because its effects are greatest in the winter and often disrupt fishing along the South American coast around Christmastime. (The naming of El Niño) When the trades strengthen and the waters of the eastern Pacific are cooler than normal it is called La Niña.
|
||||||||||||||||||||||||||||||||||||||||||||||||||||||||||||||||||||||||||||||||||||||||||||||||||||||||||||||||||||||||||||||||||||||||||||||||||||||||||||||||||||||||||||||||||||
|
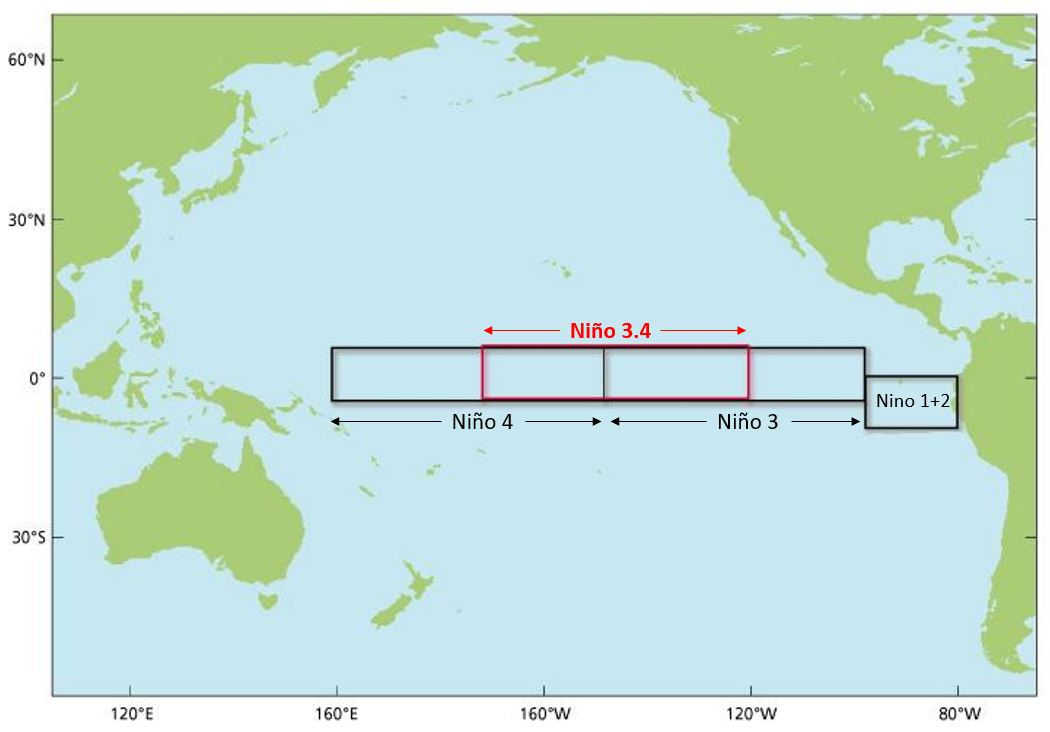
2. All El Niños and La Niñas, and their impacts, are the same No -- While El Niño and La Niña only occur in the tropics, their impacts are felt in many parts of the world. This happens because the location of the huge mass of warm water for El Niño, and cold water for La Niña, may cause the location of the jet stream, or storm track, to shift. As a consequence some regions can become warmer or colder, or wetter or drier, than historic normals. However, not all ENSO (i.e., El Niño - Southern Oscillation, the collective term for both El Niños and La Niñas) events have the same strength or location, and consequently their impacts can vary significantly. In general, the larger the area and the greater the warming of the eastern Pacific's equatorial waters, the greater the impact on other regions. The most common metric for classifying ENSO events is the Relative Oceanic Nino Index (RONI) which identifies how much above or below normal the sea surface temperatures (SSTs) are for a specific region (i.e., Niño 3.4) of the eastern tropical Pacific. Since 1950 there have been 27 years when the equatorial Pacific warmed enough to be classified as an El Niño. There have been a total of eleven seasons beginning in years (1951, 1952, 1953, 1969, 1977, 1979, 1992, 2004, 2006, 2014, 2018) classified as “weak” El Niños, nine years (1963, 1968, 1976, 1986, 1987. 1994, 2002, 2009, 2023) as “moderate”, three years (1957, 1965, 1972) as “strong” and four years (1982, 1991, 1997, 2015) as "very strong" El Niños. Conversely, there have been 26 years when the equatorial Pacific SSTs cooled than normal enough to be classified as an La Niña. A total of thirteen seasons beginning in years (1954, 1964, 1970, 1974, 1983, 1984, 1995, 2000, 2005, 2008, 2011, 2024, 2024) are classified as “weak” La Niñas, six years (1955, 2016, 2017, 2020, 2021, 2022) as “moderate” and seven years (1973, 1975, 1988, 1998, 1999, 2007, 2010) as “strong” La Niñas. (List)  [It is extremely important to note that ENSO is not the only large scale climatological phenomena that impacts the world's weather. ENSO's impact in any given year is dependent on not only its strength, but also on the location and extent of the event along the Equator in the Eastern Pacific Ocean. It's also a function of ENSO's interaction with the whole "alphabet-soup" of other Indices and Oscillations; such as the PDO (Pacific Decadel Oscillation), NAO (North Atlantic Oscillation), (AO) Arctic Oscilation (AO), (MJO) Madden-Julian Oscillation and others.] Even within the same ENSO category there can be significant differences. For example the two most recent weak El Niños, 2006-07 and 2018-19 were quite dissimilar.  And the two most recent Very Strong (i.e., ONI >2.0) El Niños also had huge variations in precipitation patterns.  Similarly, the most recent weak La Niñas in 2024-2025 and 2025-2026 had very different winter precipitation patterns in many parts of the nation, especially California.  Extensive 1950 to 2022 ENSO US Winter Precipitation Climatologies categorized by strength can be found at US El Niño or US La Niña, and detailed ENSO Climatologies for California at California El Niño and California La Niña links. |
||||||||||||||||||||||||||||||||||||||||||||||||||||||||||||||||||||||||||||||||||||||||||||||||||||||||||||||||||||||||||||||||||||||||||||||||||||||||||||||||||||||||||||||||||||
|
3. El Niño and La Niña are storms No -- El Niño is not some sort of large superstorm that sits over an area for the winter. You will never see it on a satellite, a radar image or with your binoculars at the beach! It simply causes a pattern change that sometimes leads to variations from normal precipitation and temperature patterns. And they also do not spawn storms! El Niño does not itself constitute a storm or individual weather event. It alters the large-scale ocean-atmosphere circulation and thereby changes the probability of particular weather patterns. Consequently, they should not be used as an adjective in phrases such as “El Niño flooding'', “El Niño storm” or "La Niña Drought". Think of it as the Pacific Ocean and the overlying atmosphere being on a performance-enhancing drug. And just like we don’t know why an athlete will have a great performance one day and be mediocre the next, we don’t know whether a particular weather event during an El Nino or La Niña year would have occurred anyway! |
||||||||||||||||||||||||||||||||||||||||||||||||||||||||||||||||||||||||||||||||||||||||||||||||||||||||||||||||||||||||||||||||||||||||||||||||||||||||||||||||||||||||||||||||||||
|
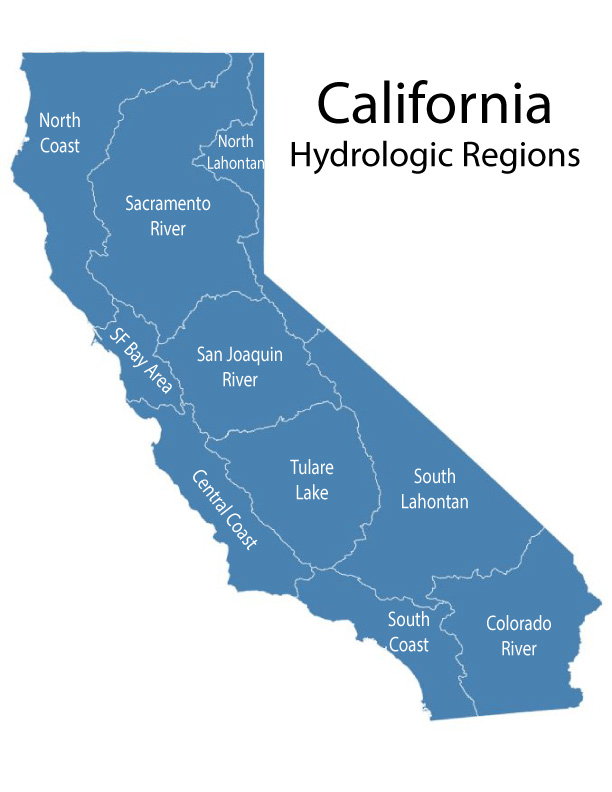
4. El Niño equates to a rainy winter in California and Elsewhere No -- The real answer is not always and not everywhere. Historical records for the past seven plus decades for the San Francisco Bay Area (i.e., Hydrologic Region), show that during the twenty-seven El Niño events the rainfall has been almost evenly split; with 8 of 27 years having well below normal precipitation (i.e., < 90%), 5 of 27 near normal (i.e., 90% to 110% of normal) and the final 13 of the years being substanially (i.e., >120%) above normal. See California El Niño and California La Niña.
Over the same span, the Sacramento Hydrologic Region (Hydrologic Region) had 13 wet (> 110%) rainfall seasons and 8 dry (< 90%) during El Niño season. The Southern California Coast (Hydrologic Region) showed more of a wet bias during El Niño with above normal rain in 17 of 27 seasons, near normal for 3, and below for 7. The bottom line is that California can get wet during El Niño, but it is near or below normal almost as often. Interestingly, the California drought in the 1976-77 winter was during a weak El Niño. It is important to keep in mind that El Niño is not the only thing happening in the atmosphere and that other global patterns can either enhance or detract from its overall impact. |
||||||||||||||||||||||||||||||||||||||||||||||||||||||||||||||||||||||||||||||||||||||||||||||||||||||||||||||||||||||||||||||||||||||||||||||||||||||||||||||||||||||||||||||||||||
|
The Bottom Line...
|
||||||||||||||||||||||||||||||||||||||||||||||||||||||||||||||||||||||||||||||||||||||||||||||||||||||||||||||||||||||||||||||||||||||||||||||||||||||||||||||||||||||||||||||||||||
Copyright © 2026, Golden Gate Weather Services.
Reproduction in full or part is prohibited without permission.