|
October
Comparative Weak and Moderate El Niño vs. California Seasonal Rainfall (2002-2003 to 2018-2019) |
|
|
October
Comparative Weak and Moderate El Niño vs. California Seasonal Rainfall (2002-2003 to 2018-2019) |
|
| This
climatology is designed as a quick reference to allow users to see
patterns, or non-patterns, between "similar" weak and moderate ENSO (El Niño Southern
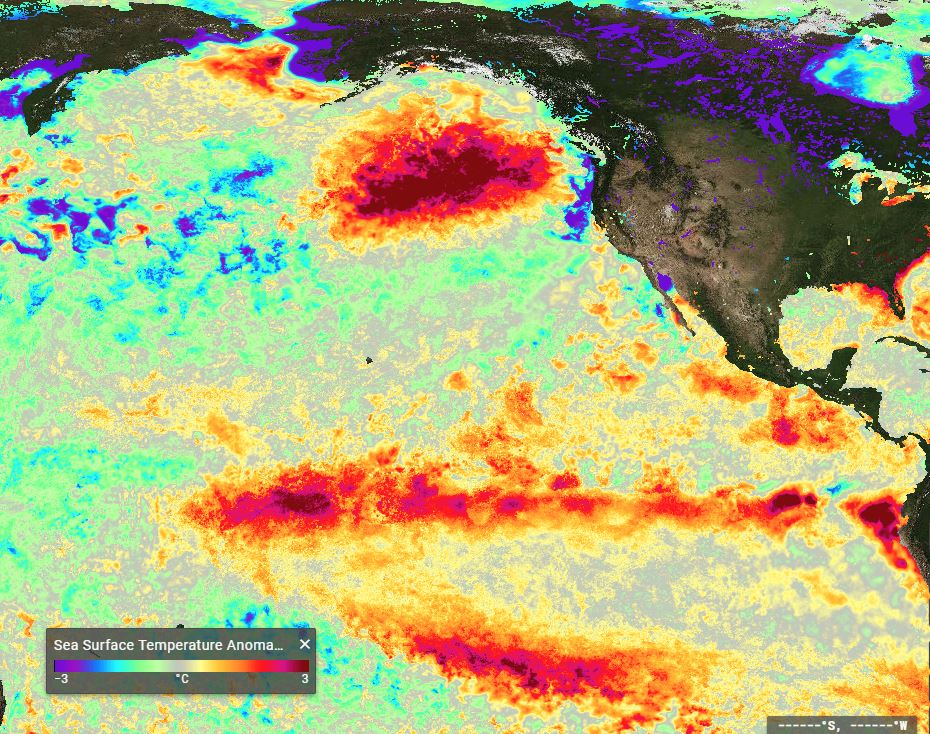
Oscillation) warm Sea Surface Temperature (SST) events using
the NASA JPL Sea Height Anomaly products. My initial takeaway
is that by looking at the bigger picture and not just the equatorial
Oceanic Niño Index (ONI) data, may give us a better idea of the
potential effects from one season over another in terms of winter
precipitation. The data here is partially a subset of that contained in "El Niño Winter Precipitation & Temperature Climatology" (http://ggweather.com/enso2016/us_elnino.html. For a breakdown of California Precipitation during El Niño events see "Climatology of El Niño Events and California Precipitation" (http://ggweather.com/enso/ca_elnino.htm). In both documents there is a very wide range of solutions, even within a single category like "weak El Niño". Like any similar climatology, the usual caveats apply that this is simply a record of past events and not intended to be a standalone forecast tool. Jan Null, CCM |
|||||
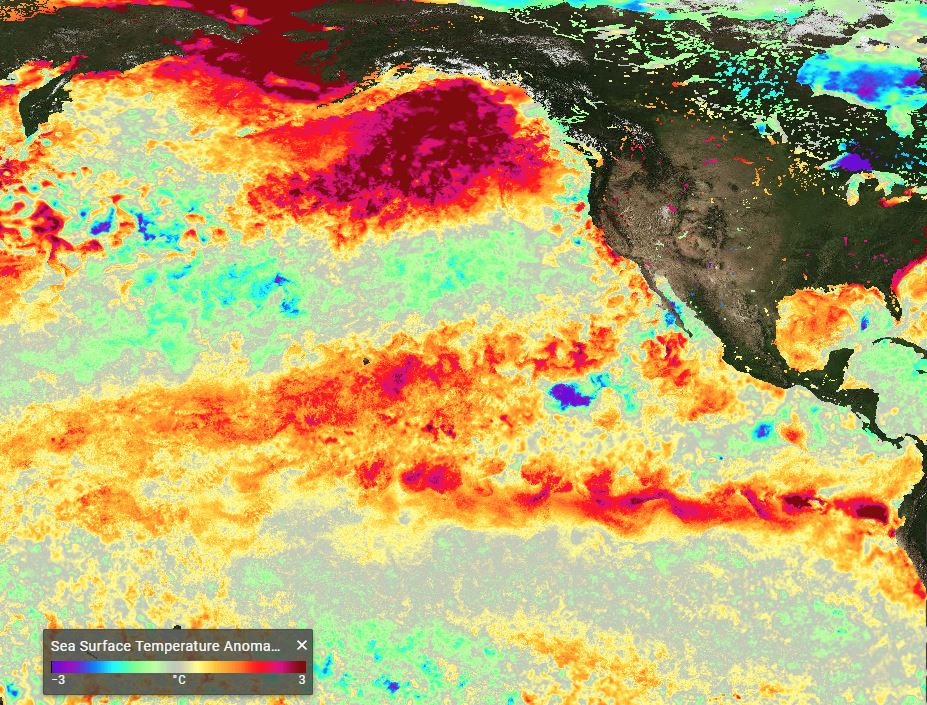
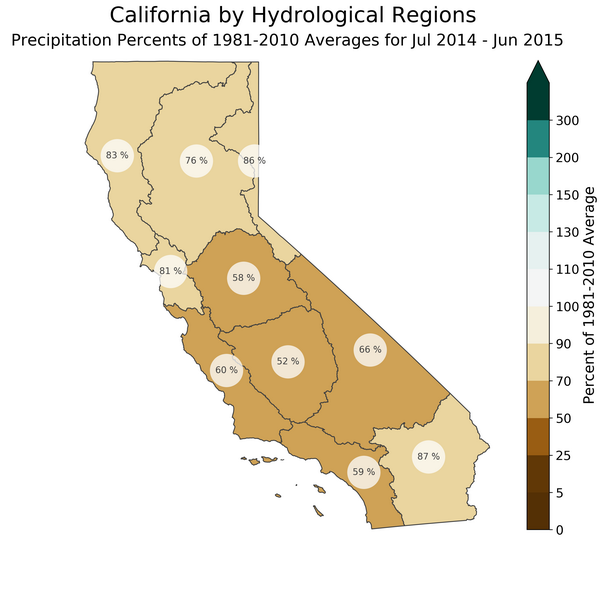
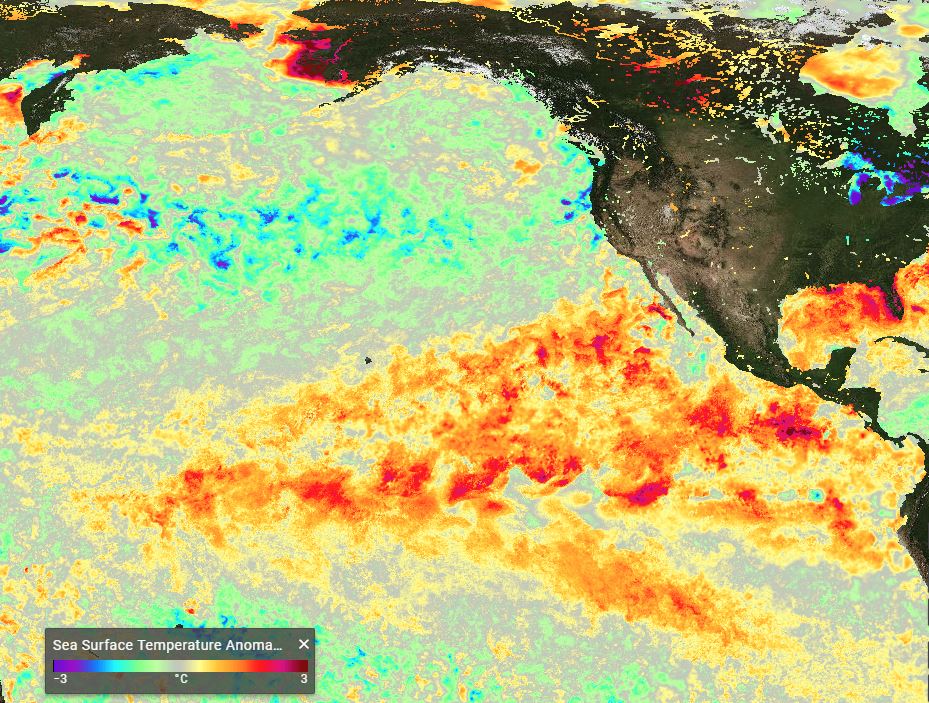
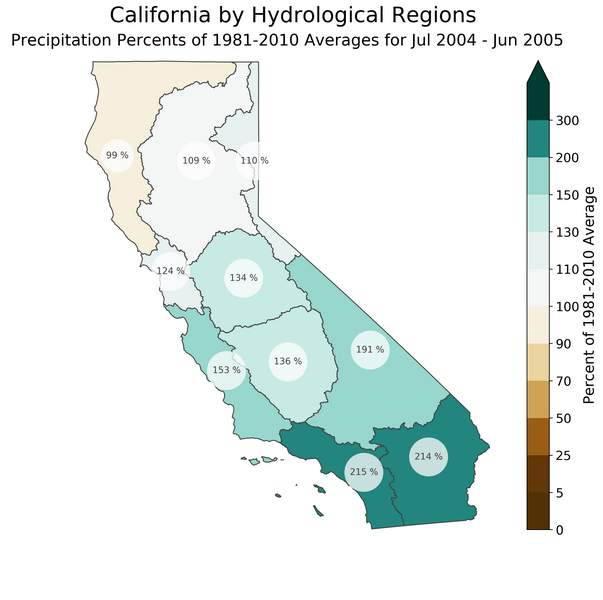
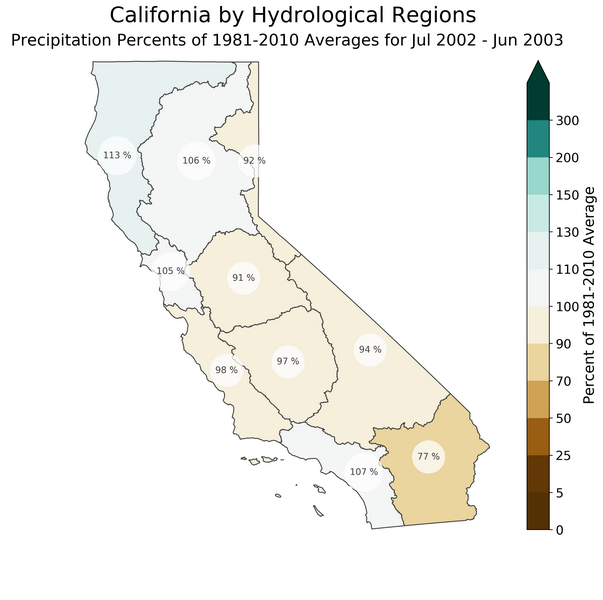
| Winter | ENSO Type | JAS ONI | Max ONI | October Sea Surface Temperature Anomaly | California Precipitation |
| 2018-19 | - | 0.1 | -- |
 |
|
| 2014-15 | Weak El Niño | +0.1 | +0.7 | 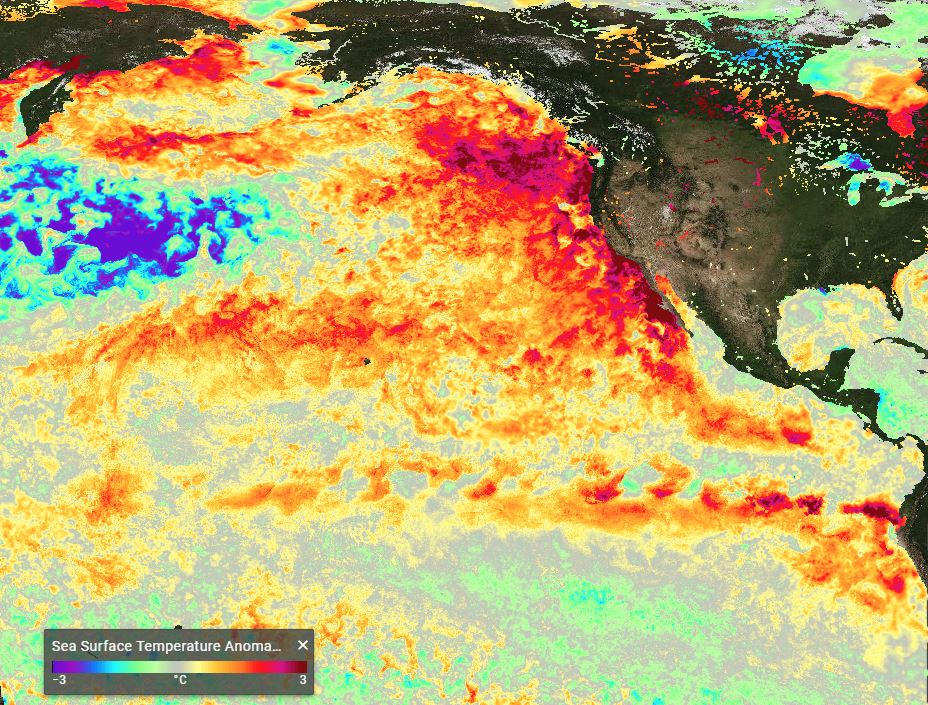 |
 |
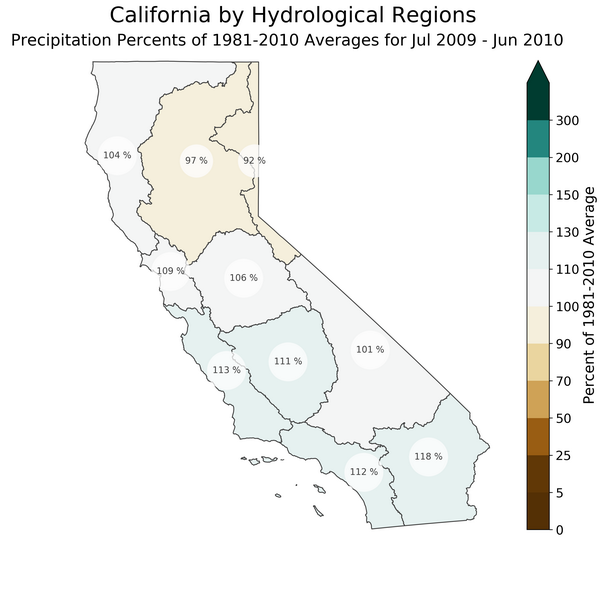
| 2009-10 | Moderate El Niño | +0.5 | +1.6 |
 |
 |
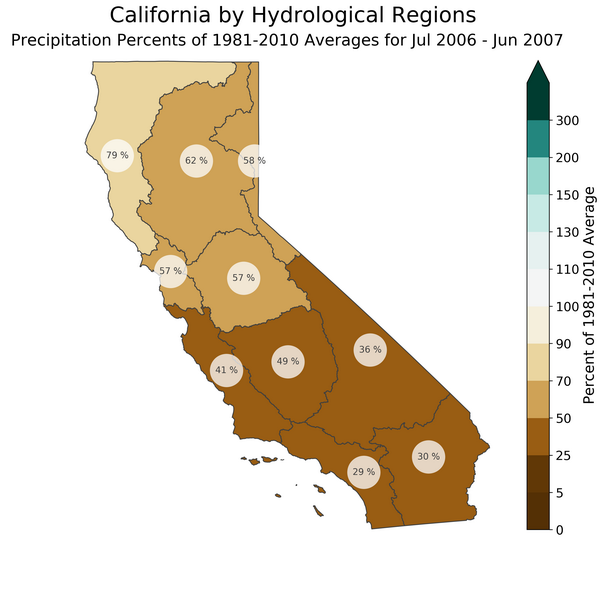
| 2006-07 | Weak El Niño | +0.1 | +0.9 | 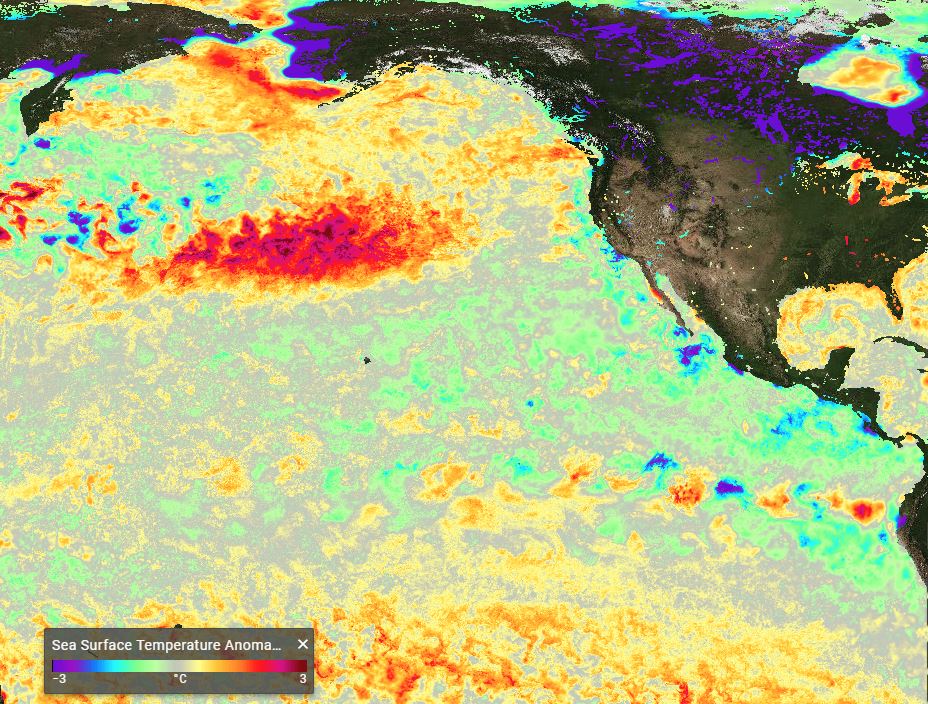 |
 |
| 2004-05 | Weak El Niño | +0.5 | +0.7 | 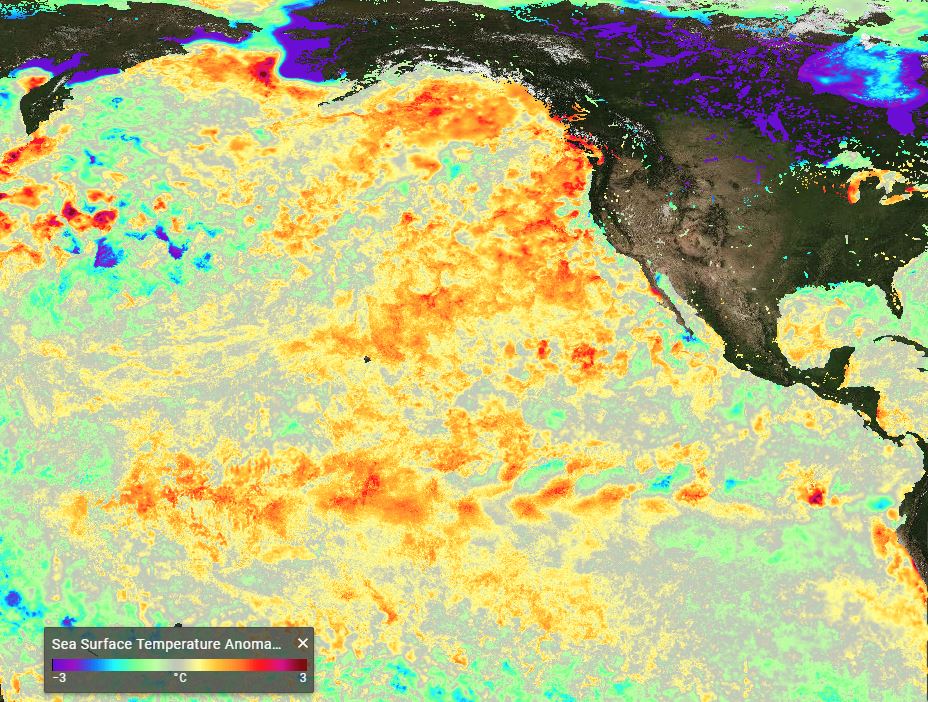 |
 |
| 2002-03 | Moderate El Niño | +0.8 | +1.3 |
 |
 |
|
Questions,
comments or suggestions. Email jnull@ggweather.com Copyright © 2018, Golden Gate Weather Services. Reproduction in full or part is prohibited without permission. |
|||||