|
ABSTRACT
Once again the latest Old Farmer's Almanac (OFA) is out with its usual boast of being
80% correct. But are they really that good? From what I have
seen in past years their accuracy is much, much worse than advertised! How
about this year?
This study found that the
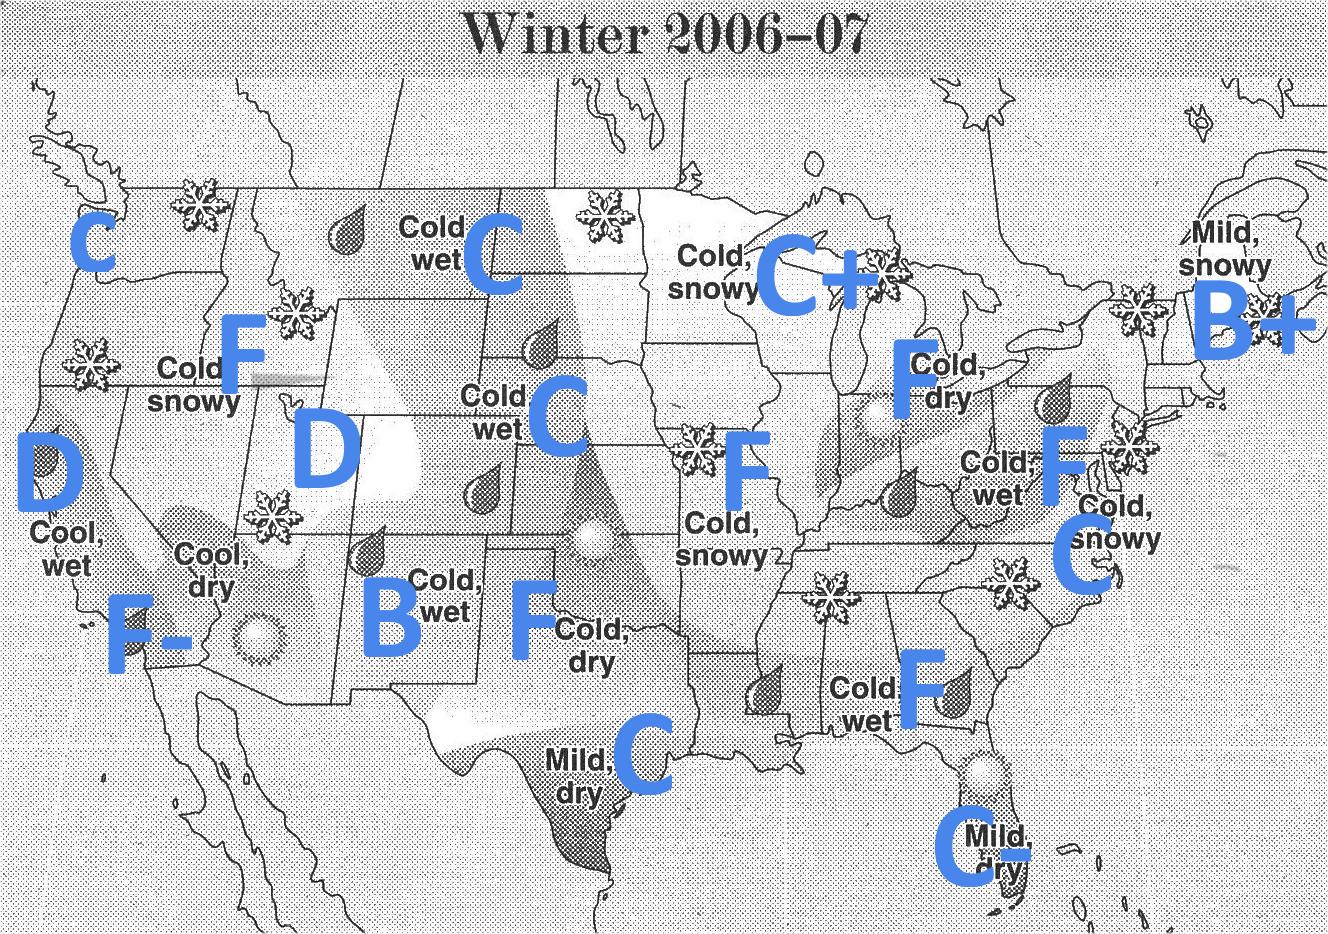
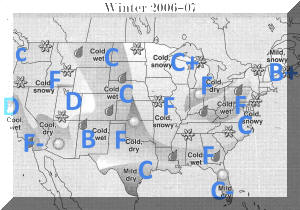
OFA national regional forecast for Winter 2006-2007 received only a
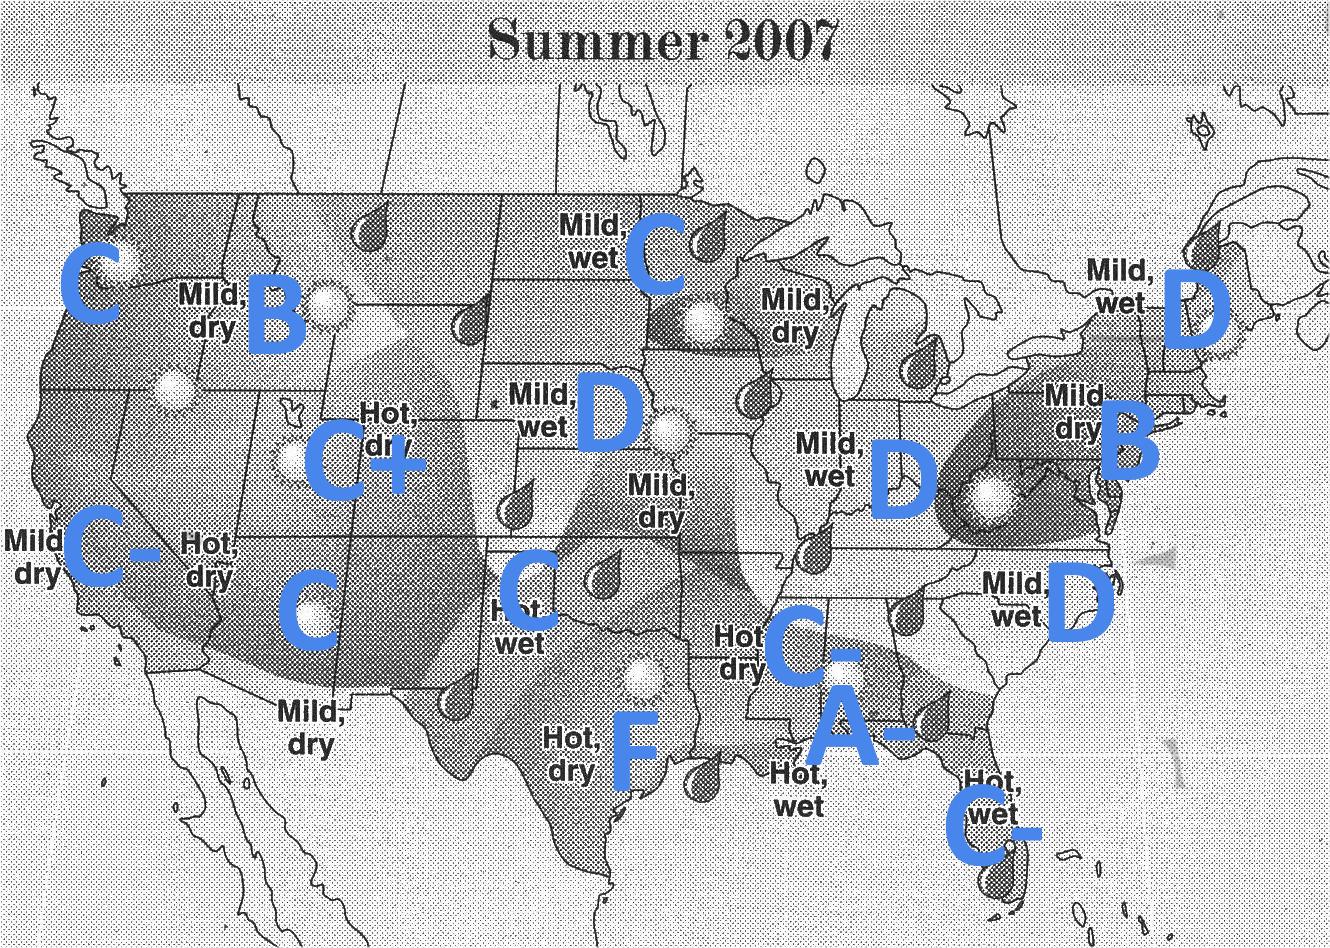
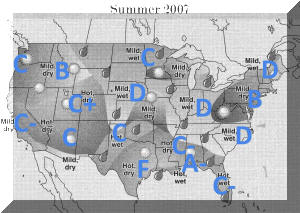
grade of D+ and the Summer forecast was
only slightly better with a C grade. In California the OFA forecasts for
temperature were right only 43% of the time and the precipitation was
correct 40% of the time.
DATA
Last November's 2007 edition of
the Old Farmer's Almanac (Yankee Publishing, Dublin NH, 2006) was
examined.
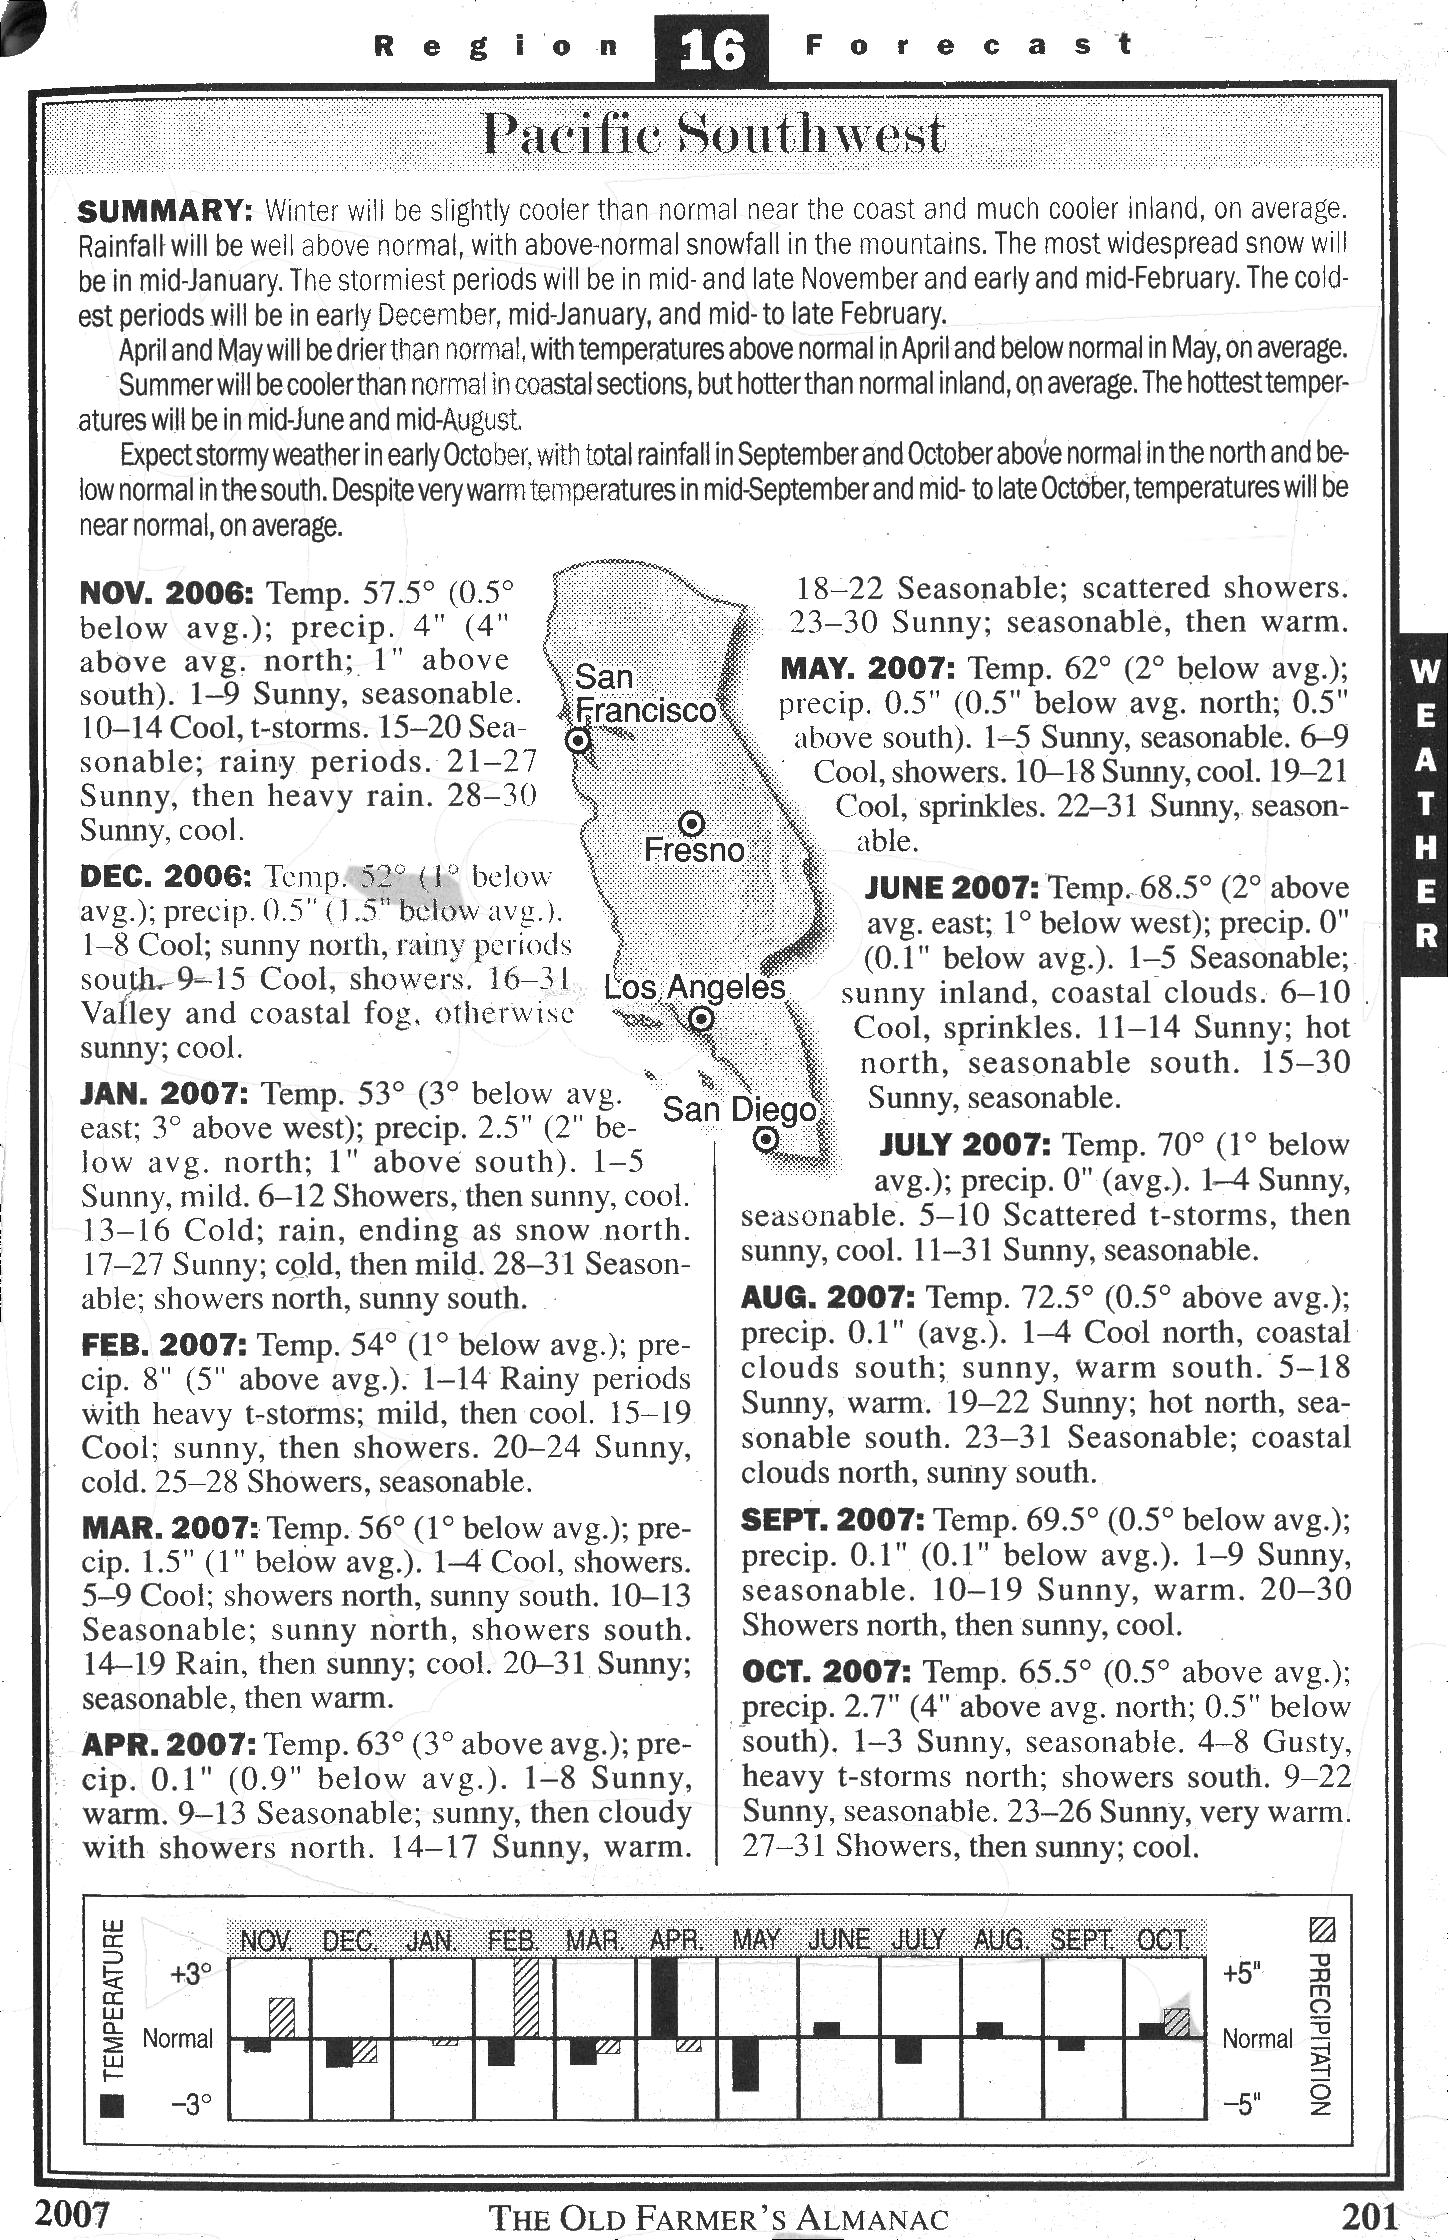
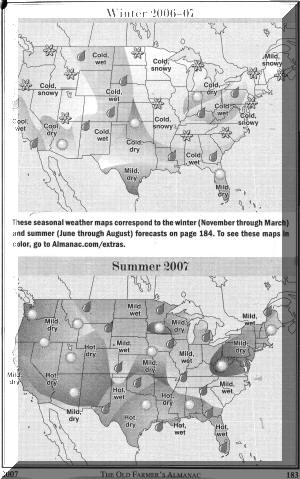
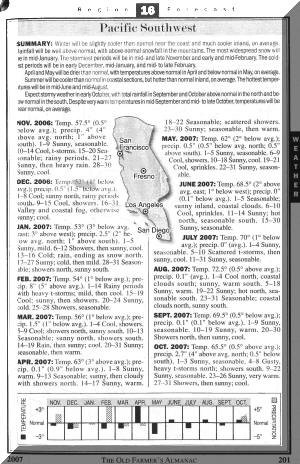
There are seasonal weather graphics for winter and summer (Fig. 1) from the 2005 Old Farmer's Almanac. The weather forecast section of the is
also divided into 16 regions.
Region 16 encompasses the southern three-fourths of California and is
broken down by month with "forecasts" of how the temperature and
precipitation compare to normal.
Figures 2 is the actual forecast
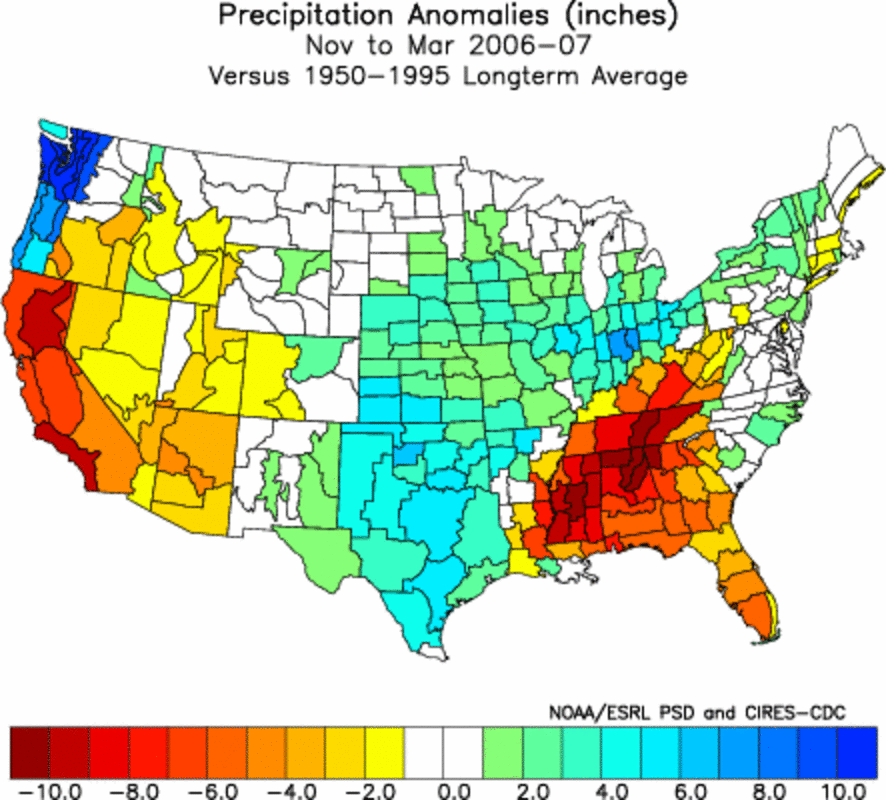
for Region 16 from the Almanac. The OFA seasonal forecasts for the nation
were evaluated for the Winter (November through March) and Summer (June
through August) using the temperature
and rainfall departures from normal by month for the United States Climate
Divisions (NOAA-CIRES Climate Diagnostics Center
US Climate
Divisions Plotting Page).
| Fig. 1 |
Fig. 2 |
 |
 |
To evaluate the Region 16 forecasts each monthly forecast was compared to the actual monthly temperature and precipitation anomalies by climate
division. Data for climate divisions was chosen
because of the large number of sites that are used in determining the
division average, thus eliminating the bias of a single station.
Temperatures were evaluated for all 12 months while precipitation was only
looked at for
the the California "wet" season of November through April.
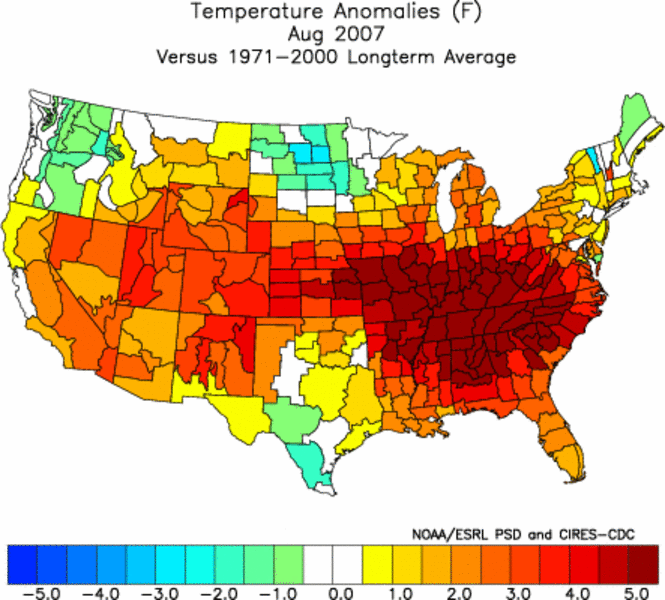
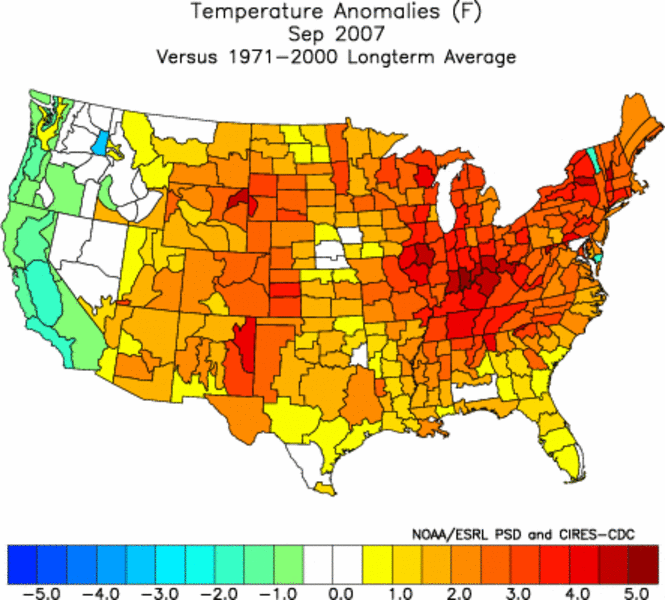
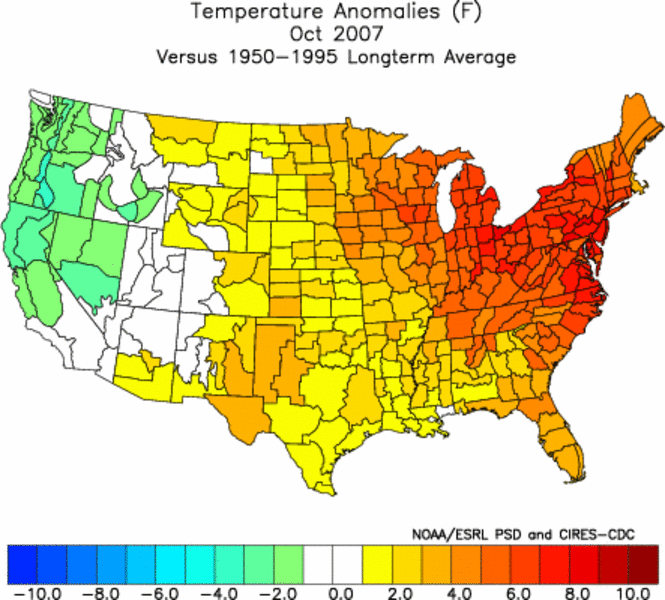
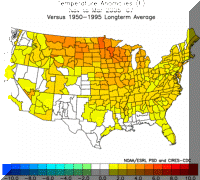
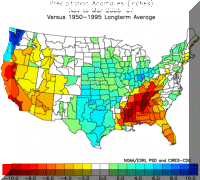
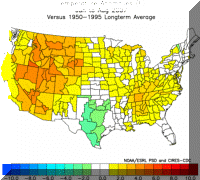
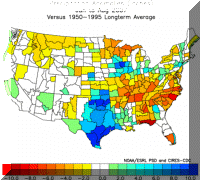
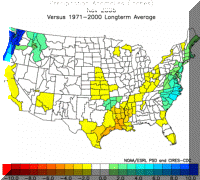
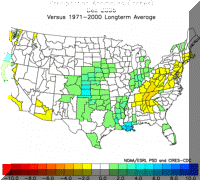
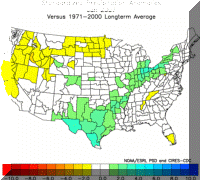
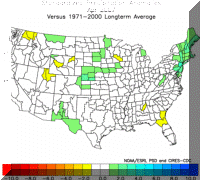
Seasonal U.S. Climate Division Temperatures
and Precipitation (Nov. 2006 - Mar. 2007) and (Jun. - Aug. 2007)
| Winter Temperature |
Winter Precipitation |
Summer Temperature |
Summer Precipitation |
 |
 |
 |
 |
The "graded" seasonal forecasts below are a subjective verification of the
Old Farmer's Almanac seasonal forecasts. The basic methodology was
to deduct a grade for each part portion of a regional forecast that was
incorrect and two grades if the sign was also incorrect. If both the
temperature and precipitation forecast were correct and had the
appropriate magnitude then the region would get an "A" grade".
Overall the seasonal forecasts averaged a grade of about "C-".
None of the 15 Winter forecasts got both the temperature and precipitation
close enough to receive an A,
and just 1 of the 15 Summer forecasts verified.
"Graded" Seasonal Forecasts
| Winter |
Summer |
 |
 |
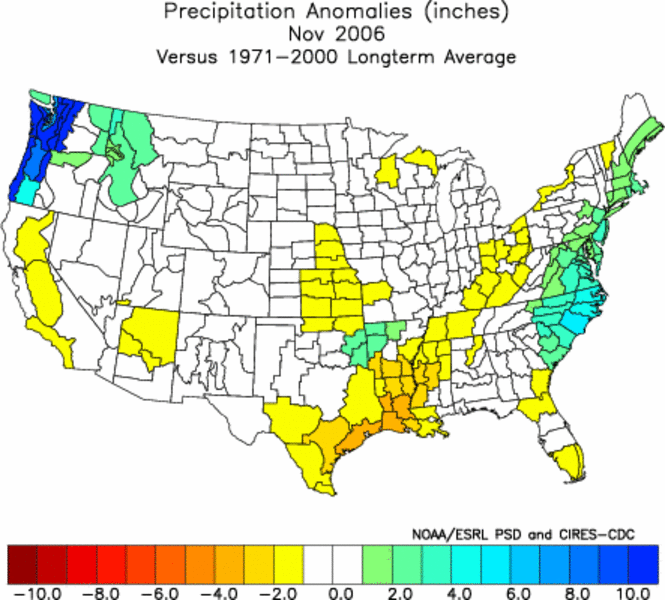
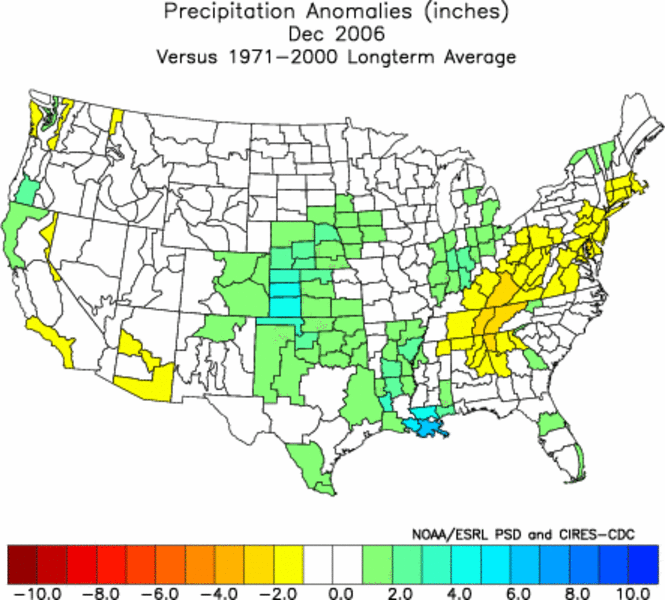
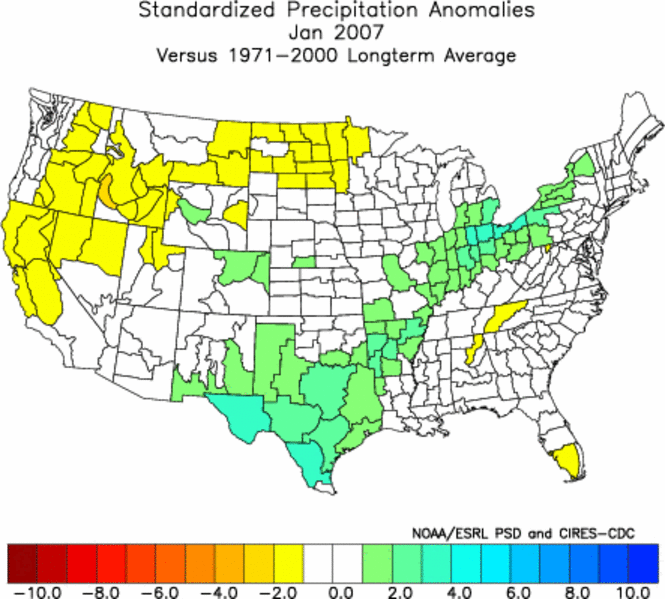
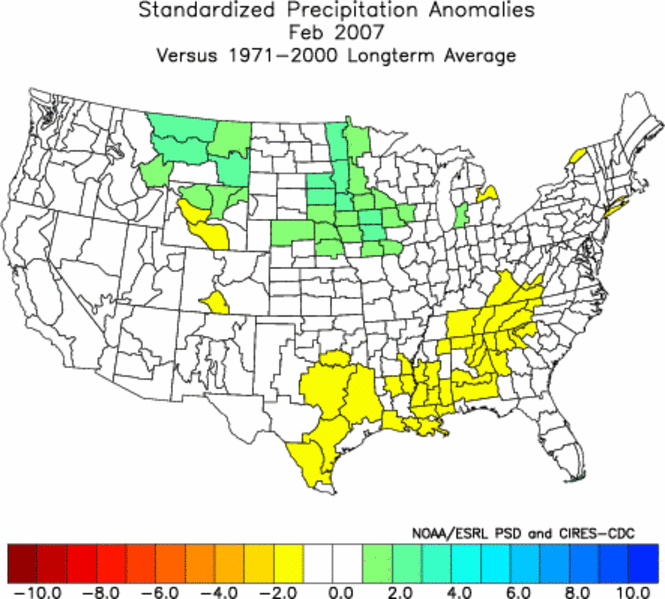
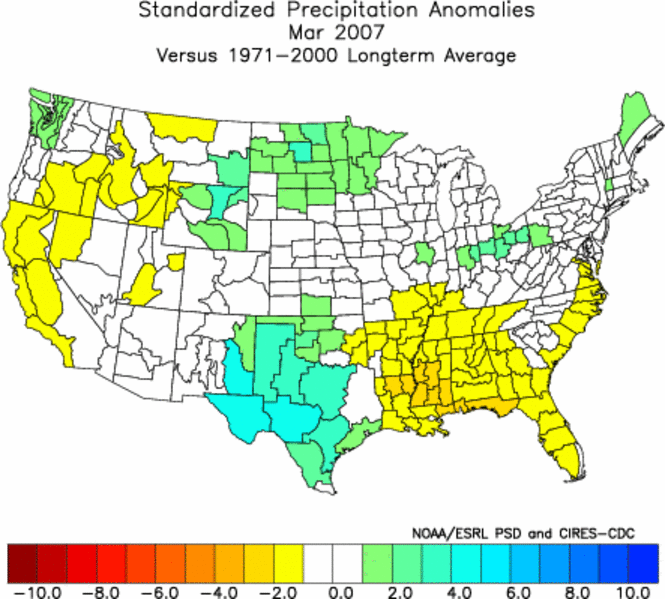
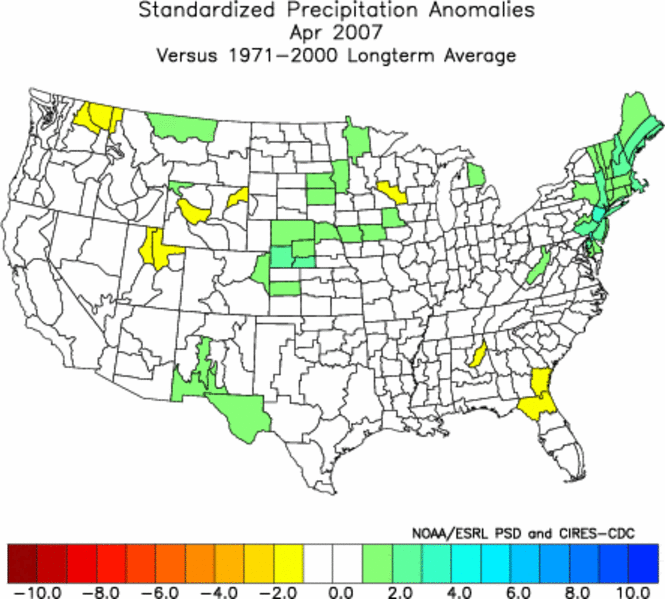
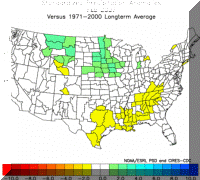
Monthly U.S. Climate Division Precipitation
(Nov. 2006 - Apr. 2007)
|
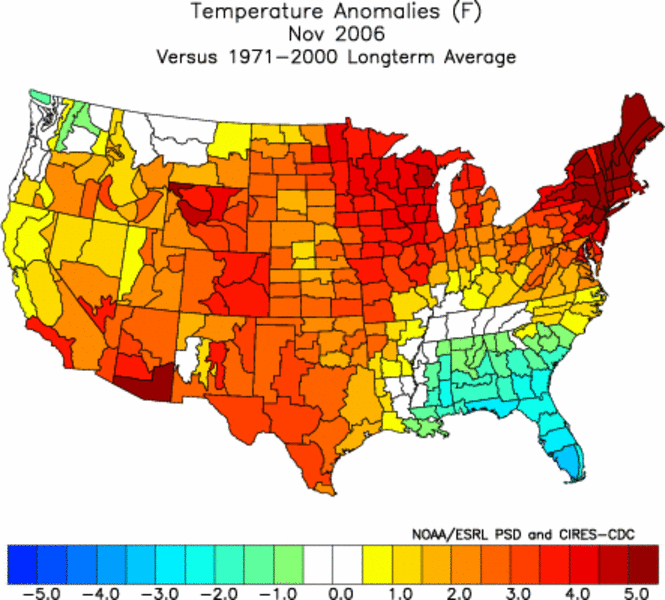
Nov 2006 |
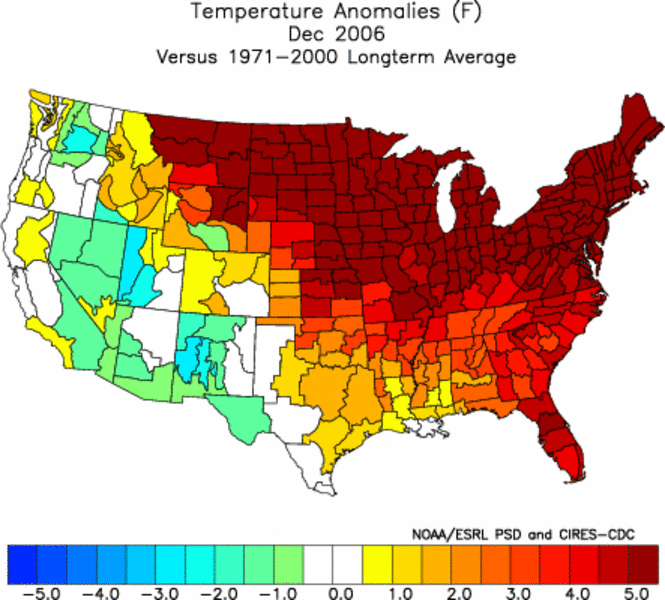
Dec 2006 |
Jan 2007 |
Feb 2007 |
 |
 |
 |
 |
|
Mar 2007 |
Apr 2007 |
|
|
|
 |
 |
|
|
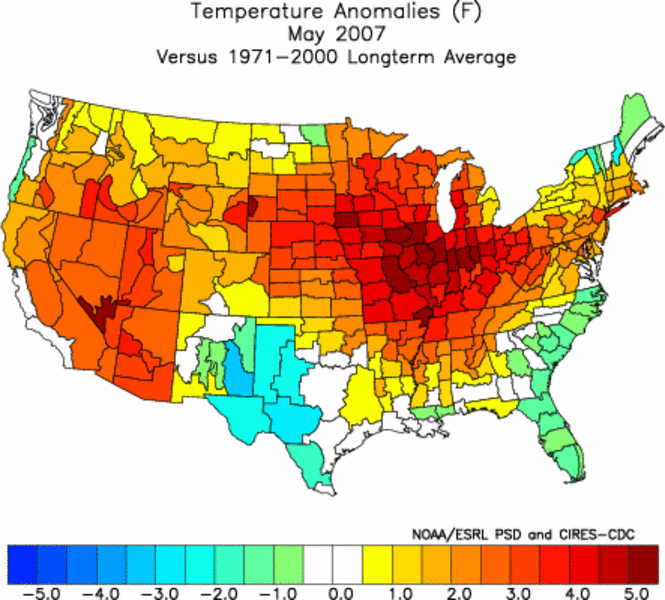
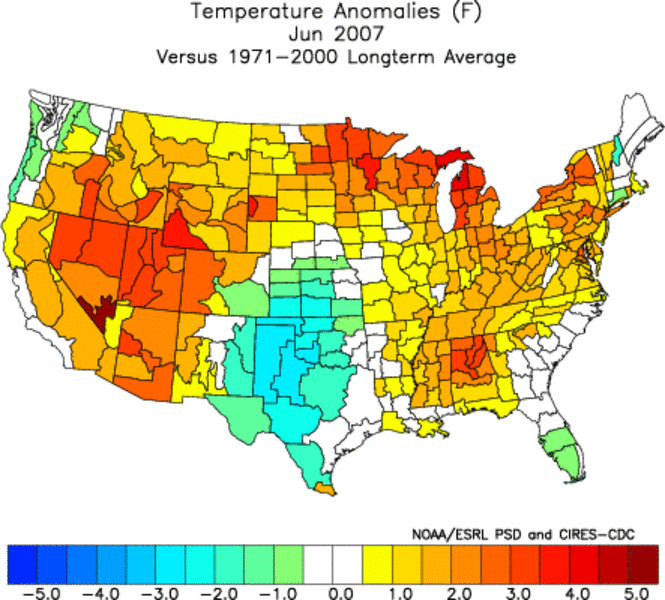
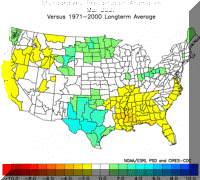
Monthly U.S. Climate Division Temperatures
(Nov. 2006 - Oct. 2007)
ANALYSIS
The subjective analyses in the table below compares the monthly
forecasts for Region 16 from the 2005 OFA
with the actual observed monthly climate division anomalies of
temperature and precipitation. Because of the scarcity of rainfall in
the California in the summer months,
precipitation for the months May through October was not evaluated.
Furthermore, if either the forecasts or the observed data were geographically
split then separate analyses were done for each geographic area.
The observed data has been color-coded to reflect each of
three categories. Forecasts which were judged correct are
blue. Those
which had the right sign (i.e., above normal observed when above was
forecast or below normal observed when below was forecast) but where the quantity
was incorrect are coded in yellow.
Forecasts that had a large range that was partially corrected are colored
orange. And forecasts which had the wrong sign
are coded red.
SUMMARY
For California, Region 16, a total of
10 precipitation forecasts and 24 temperature forecasts were evaluated.
Of the precipitation cases 40% were correct, 10% were quantitatively wrong
and the remaining 50% had the incorrect sign. The temperatures for
region 16 were correct 46% of the time, had the wrong sign in 33% of
the cases, were quantitatively wrong 21% of the time. Overall the
California forecasts were correct only 43% of the time, which is an
improvement over previous years. But it should be noted that the
2006-2007 winter forecast for Southern California was abysmal as it
forecast above normal winter rains when in fact Southern California had
a record DRY season!
Table 1. Analysis Region 16 - California
|
Precipitation |
Temperature |
| |
OFA |
Observed |
OFA |
Observed |
| Nov. 04 |
4" above North
1" above South |
1"
below |
0.5º below normal |
4º
above normal North
3º above normal South |
| Dec. 04 |
1.5" below normal |
1"
above normal North
1" below normal South |
1º below normal |
1º above
normal North
Normal South |
| Jan. 05 |
2" below North
1" above South |
3" below normal North
2.5" below normal South |
3º below East
3º above West |
2º below normal East
2º below normal Wast |
| Feb. 05 |
5" above |
0.5" above normal North
2" below normal South |
1º below normal |
1º below
normal North
Normal South |
| Mar. 05 |
1" below normal |
4"
above normal North
1" below normal South |
1º below normal |
5º below normal North
4º below normal South |
| Apr. 05 |
0.9" below normal |
Normal |
3º above normal |
Normal North
2º below normal
South |
| May 05 |
|
|
2º below normal |
2º above normal
North
1º below normal South |
| Jun. 05 |
|
|
2º above East
1º below West |
Normal North
2º below
normal South |
| Jul. 05 |
|
|
1º below normal |
1º above
normal North
0.5º below normal South |
| Aug. 05 |
|
|
0.5º
above normal |
1º above
normal North
Normal South |
| Sep. 05 |
|
|
0.5º
below normal |
1º below normal North
2º below
normal South |
| Oct. 05 |
|
|
0.5º
above normal |
2º below normal North
Normal South |
|