|
ABSTRACT
This study found that the
OFA national regional forecasts for Winter 2008-2009 (Nov. - Mar.) received only a
cumulative grade of D. The overall regional
grades, based on the monthly analysis for the month of November through
March,
were only slightly better, ranging from a D- for the Southeast to a C+
in the High Plains.
DATA
Last November's 2009 edition of
the Old Farmer's Almanac (Yankee Publishing, Dublin NH, 2006) was
examined.
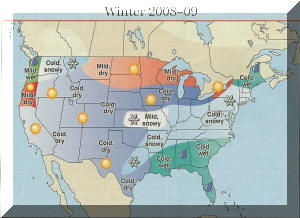
There was a seasonal weather graphic for the winter season (Fig. 1) as
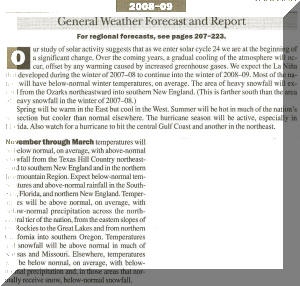
well as a textual forecast (Fig. 2). The weather forecast section of the
Almanac is
also divided into 16 geographical regions.
| Fig. 1 OFA Winter
Forecast Graphic |
Fig. 2 OFA Winter
Forecast Text |
 |
 |
Text forecasts for five regions (Atlantic
Corridor, Southeast, Lower Lakes, High Plains and Pacific Southwest)
were chosen to evaluate as geographically diverse as well as
encompassing most of the major metropolitan areas (Fig. 3-7).
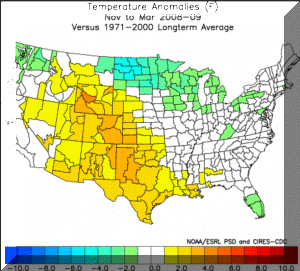
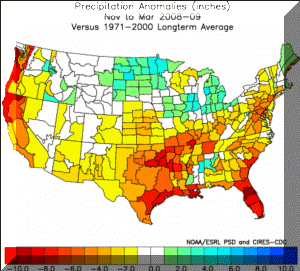
The 2008-2009 winter season national
forecast (Fig. 1-2) was evaluated against the temperature and
precipitation anomalies for the period of November 2008 through March
2009 as downloaded from the NOAA Climate Analysis Branch US Climate
Division Dataset. (Fig. 8-9)
| Fig. 8 |
Fig. 9 |
 |
 |
To evaluate the OFA monthly regional forecasts each monthly forecast was compared to the actual monthly temperature and precipitation anomalies by climate
division. Data for climate divisions was chosen
because of the large number of sites that are used in determining the
division average, thus eliminating the bias of a single station.
Precipitation and temperatures were evaluated for the winter months of
December through March.
U.S. Climate Division Temperatures
and Precipitation (Dec. 2008 - Mar. 2009)
|
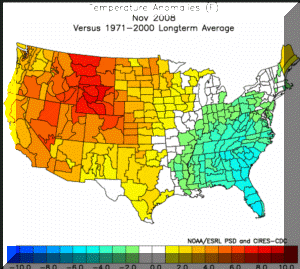
Fig. 10 Nov 2008 Temperature |
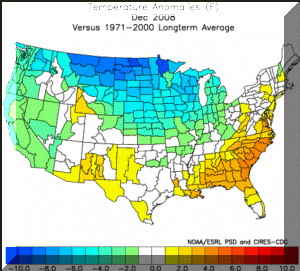
Fig. 11 Dec 2008 Temperature |
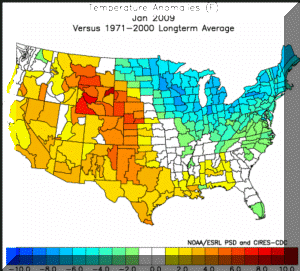
Fig. 12 Jan 2009 Temperature |
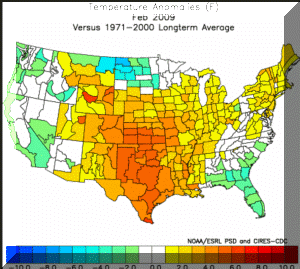
Fig. 13 Feb 2009 Temperature |
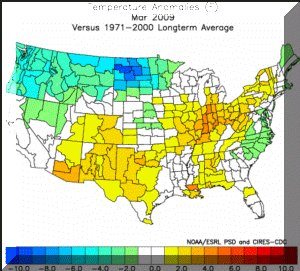
Fig. 14 Mar 2009 Temperature |
 |
 |
 |
 |
 |
|
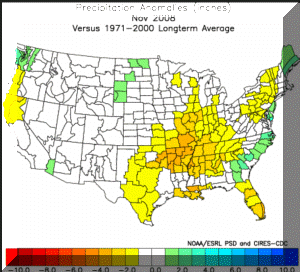
Fig. 15 Nov 2008 Precipitation |
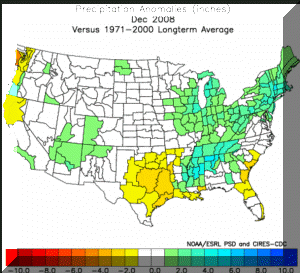
Fig. 16 Dec 2008 Precipitation |
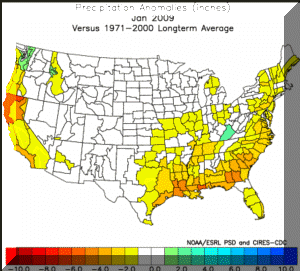
Fig. 17 Jan 2009 Precipitation |
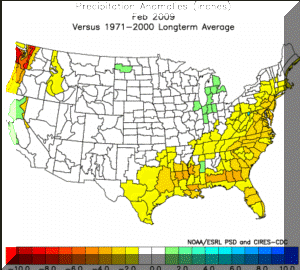
Fig. 18 Feb 2009 Precipitation |
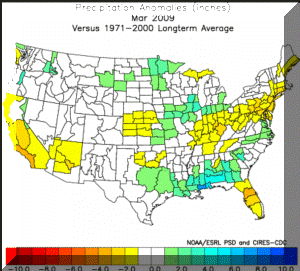
Fig. 19 Mar 2009 Precipitation |
 |
 |
 |
 |
 |
ANALYSIS
Grading
The forecasts were graded on their
performance against the observed temperatures and precipitation data
based on whether the sign of the anomaly was correct and if the
magnitude of the anomaly was correct within +/- 2 degrees for temperatures
and +/- 2 inches for precipitation. Because of the vagueness of
the forecasts and the large geographical forecast areas, there is a measure of
subjectivity in assigning grades, but every effort has been made to be
fair and impartial. The grading scale used was as follows:
A - Both the sign of the anomaly and the magnitude were correct.
B - The sign of the anomaly was correct, but the magnitude was wrong.
C - Wide variance within the forecast area with a portion correct and a
portion incorrect.
D - The sign of the anomaly in wrong, but the magnitude is basically
correct.
F - Both the sign and magnitude were incorrect.
| Fig 20. Graded Winter
Forecast |
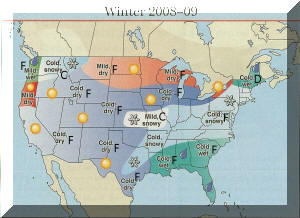 |
The analysis of the Winter forecast showed that the
character of the winter was missed across most of the nation. The
introductory paragraph of forecast text (Fig. 2) highlighted 1) "Most of
the nation will have below normal winter temperatures" and 2) "the area
of heavy snowfall will extend from the Ozarks northeastward into
southern New England". From the Nov. to Mar. temperature anomalies
(Fig. 8) most of the nation was normal to above normal. And from
the precipitation anomalies (Fig. 9) the region from the Ozarks to New
England had well below normal precipitation. The graded winter
forecast (fig. 20) is based on the OFA Winter Forecast Graphic (Fig. 1)
compared to the winter season temperature and precipitation anomalies
(Fig. 8-9).
Fig. 21. Graded Monthly Regional
Forecasts
|
|
Atlantic Corridor |
Southeast |
Lower Lakes |
High Plains |
Pacific Southwest |
|
Forecast |
Observed |
Grade |
Forecast |
Observed |
Grade |
Forecast |
Observed |
Grade |
Forecast |
Observed |
Grade |
Forecast |
Observed |
Grade |
|
Nov |
Temp |
3.0 |
0.0 to -3.0 |
F+ |
0.0 |
-3.0 to -6.0 |
D |
4.0 |
0.0 to -2.0 |
F |
4.0 |
+2.0 to +6.0 |
A |
-1.0 |
+2.0 to +5.0 |
F |
|
Precip |
0.5 |
0.0 to +2.0 |
B |
-1.0 |
0.0 to +2.0 |
D+ |
-1.0 |
0.0 to -4.0 |
B+ |
-0.5 |
0.0 |
A- |
0.5 |
0.0 |
A- |
|
Dec |
Temp |
-5.0 |
+1.0 to +3.0 |
F |
-6.0 |
+3.0 to +5.0 |
F- |
-4.0 E,
-11.0 W |
0.0 to -2.0 |
F |
-2.5 |
-10.0 N,
+1.0 S |
F |
2.0 |
-2.0 to -3.0 |
F |
|
Precip |
-0.5 |
+1.0 to +3.0 |
F |
0.5 |
-2.0 to +2.0 |
D |
-1.0 |
+1.0 to +3.0 |
F+ |
0.5 |
0.0 |
A |
-1.5 |
0.0 to +2.0 |
F+ |
|
Jan |
Temp |
2.0 |
0.0 to -2.0 |
F |
0.5 |
0.0 to -2.0 |
C |
5.0 |
-4.0 to -7.0 |
F- |
+4.0 N,
0.0 S |
+4.0 to -4.0N,
+3.0 to 7.0 S |
F+ |
-1.0 |
+1.0 to +4.0 |
F |
|
Precip |
1.5 |
-1.0 to -3.0 |
F |
0.0 N,
2.0 S |
-2.0 to -4.0 |
F |
-1.0 |
0.0 to -2.0 |
A |
0.0 |
0.0 |
A |
-1.0 |
-2.0 to -5.0 |
C |
|
Feb |
Temp |
-0.5 |
+1.0 to +3.0 |
F |
-3.0 |
0.0 to +2.0 |
F |
0.0 |
+1.0 to +3.0 |
C- |
+2.0 N,
-7.0 S |
+1.0 to -4.0N,
+4.0 to 5.0 S |
F |
-2.0 |
0.0 to -3.0 |
A |
|
Precip |
-1.0 N,
+1.0 S |
-2.0 N,
-2.0 to -3.0 S |
C- |
0.0 N,
+4.0 S |
-1.0 to -3.0 N,
-1.0 to -3.0 S |
F |
-1.0 |
0.0 to +1.0 |
C |
0.0 |
0.0 |
A |
-2.0 |
0.0 to -2.0 |
B+ |
|
Mar |
Temp |
-2.0 |
0.0 to -2.0 |
B- |
-2.0 |
0.0 to +2.0 |
F |
-3.0 |
1.0 to +4.0 N,
0.0 to +3.0 S |
F+ |
-4.0 |
-4.0 to -8.0N,
0.0 to +3.0 S |
C |
-2.0 |
0.0 |
B+ |
|
Precip |
-0.5 |
-1.0 to -3.0 |
B- |
0.0 |
0.0 to +1.0 |
A- |
2.0 |
0.0 to +1.0 |
B |
0.0 |
0.0 |
A |
-1.0 |
-2.0 to -4.0 |
B |
The Graded Monthly Regional Forecasts are
based on a comparison of the OFA regional forecasts (Fig. 3-7) and the
monthly temperature and precipitation anomalies (Fig. 10-19).
Grades were assigned based on the criteria above. The best
forecasts were for the High Plains for November 2008 with both the
temperature and precipitation forecasts correct. However, the rest
of the season for that region had a very poor showing for the
temperature forecasts. The worst forecasts were in the Atlantic
Corridor for December and January with poor forecasts for both
precipitation and temperature.
The overall grades by region (Fig. 21)
showed the Atlantic Corridor, Southeast and Lower Lakes all getting a
grade of "D", while the High Plains and Pacific Southwest received
slightly better overall grades of "C". The total grade
distribution for all the regions showed a total of 11 A's, 6 B's, 6 C's,
3 D's and an astounding 23 F's!
|
