-
Source:
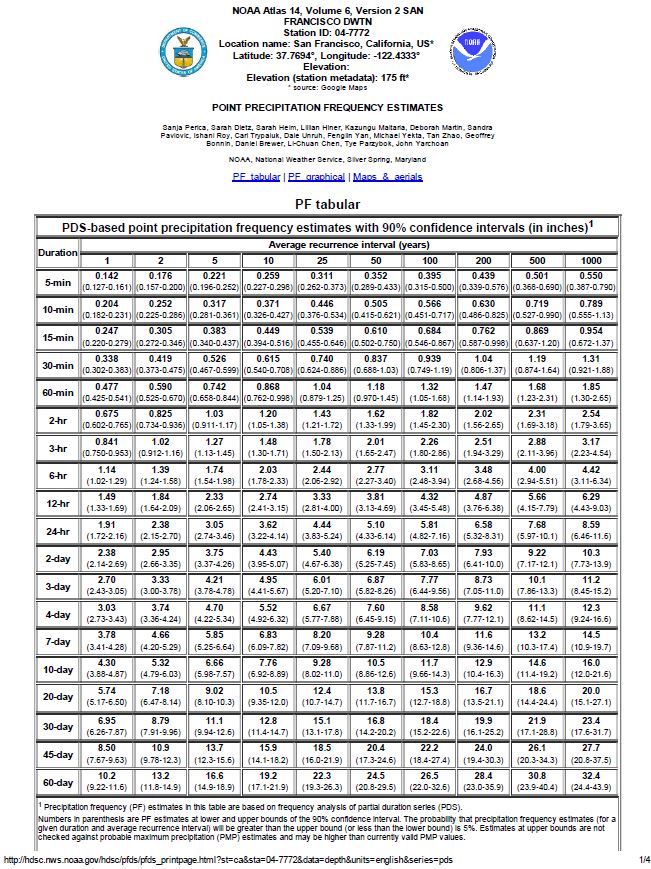
NOAA Atlas 14 - California
-
Example: A 6-hour - 100
Year storm (i.e., 6 consecutive hours of rain) with a return period
of 100 years would statistically be 3.11 inches.
-
VERY IMPORTANT NOTE: A 100-year storm means that
there is a 1-in-100 probability of a similar event in any given
year. It does NOT mean there is an interval of 100 years
between events.
Return to Climate of San
Francisco Homepage
Return to
Golden Gate Weather Services
Copyright © 2014, Golden Gate Weather Services.
Reproduction in full or part is prohibited without
permission.
|