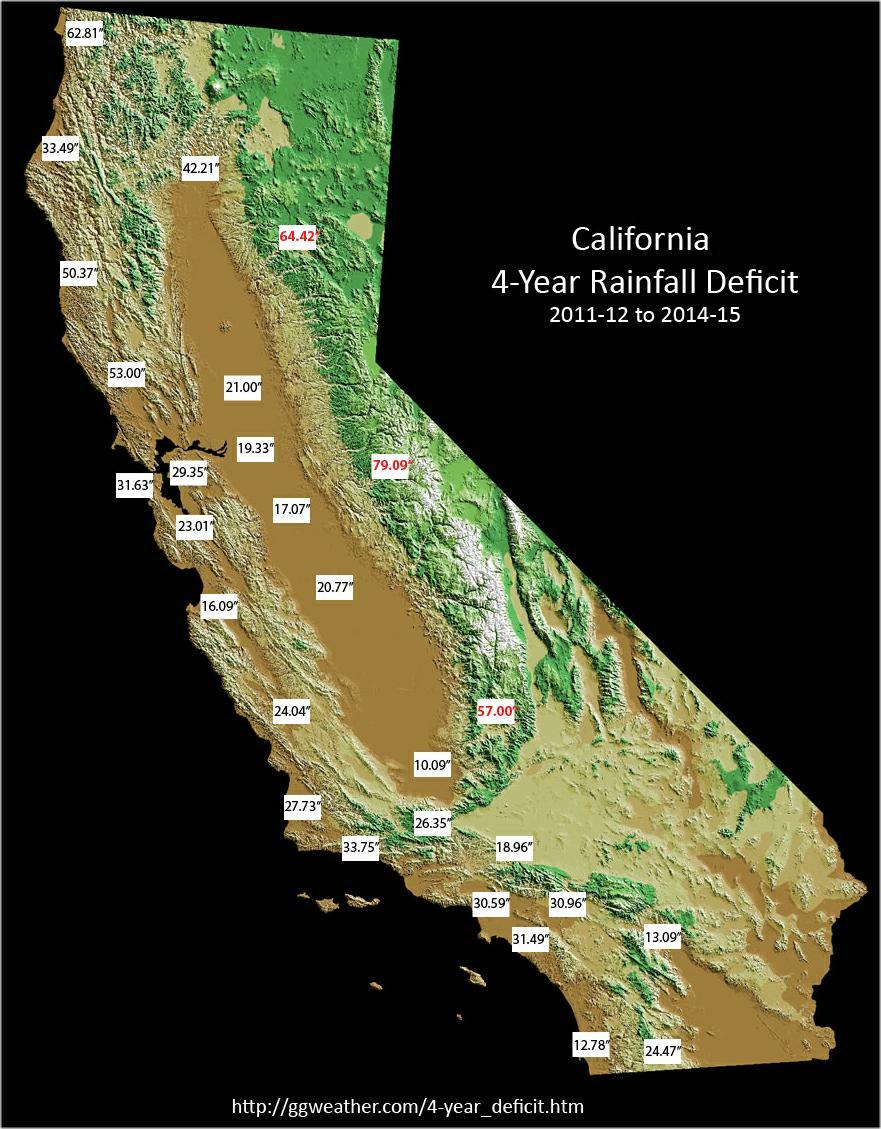
These tables and chart show the total deficit 
		in California rainfall since the 2011-2012 season July 1 to June 30) in 
		both inches and percent of normal. 
		 For example, San 
		Francisco is 31.63 inches behind their normal four-year total.  
		Consequently, to make up all of the deficit, the rainfall that San 
		Francisco would need 
		this coming winter would be 55.28" (i.e., 31.63" + 23.65") or 234% of 
		normal. [The all time record for San Francisco is 49.27"!!] 
		 It should be noted 
		that making up the rainfall deficit is very different than the 
		requirements to "end the drought" as the components of a drought are 
		dependant upon a myriad of variables like the type of user, population, 
		existing supplies etc.  


				| 
				 | 
				 | 
				
				4-year Deficit | 
			 
			
				| 
				...NORTHERN CALIFORNIA... | 
				Normal | 
				in. | 
				% Normal | 
			 
			
				| 
				Crescent City | 
				64.03 | 
				62.81 | 
				98% | 
			 
			
				| 
				Eureka | 
				40.33 | 
				33.49 | 
				83% | 
			 
			
				| 
				Ukiah | 
				37.35 | 
				50.37 | 
				135% | 
			 
			
				| 
				Redding | 
				34.62 | 
				42.21 | 
				122% | 
			 
			
				| 
				Sacramento | 
				18.52 | 
				21.00 | 
				113% | 
			 
			
				| 
				Santa Rosa | 
				36.28 | 
				53.00 | 
				146% | 
			 
			
				| 
				San Francisco | 
				23.65 | 
				31.63 | 
				134% | 
			 
			
				| 
				Oakland | 
				20.81 | 
				29.35 | 
				141% | 
			 
			
				| 
				San Jose | 
				14.90 | 
				23.01 | 
				154% | 
			 
			
				| 
				Nrn Sierra 8-Station Index (map) | 
				
				54.53 | 
				64.42 | 
				118% | 
			 
			
				 | 
				 | 
				 | 
				 | 
			 
			
				 | 
				 | 
				4-year Deficit | 
			 
			
				| 
				...CENTRAL CALIFORNIA... | 
				Normal | 
				in. | 
				% Normal | 
			 
			
				| 
				Stockton | 
				14.06 | 
				19.33 | 
				137% | 
			 
			
				| 
				Modesto | 
				13.11 | 
				17.07 | 
				130% | 
			 
			
				| 
				Fresno | 
				11.50 | 
				20.77 | 
				181% | 
			 
			
				| 
				Bakersfield | 
				6.47 | 
				10.09 | 
				156% | 
			 
			
				| 
				Salinas | 
				12.83 | 
				16.09 | 
				125% | 
			 
			
				| 
				Paso Robles | 
				12.78 | 
				24.04 | 
				188% | 
			 
			
				| 
				Santa Maria | 
				13.95 | 
				27.73 | 
				199% | 
			 
			
				| 
				San Joaquin 5-Station Index (map) | 
				
				42.51 | 
				79.09 | 
				186% | 
			 
			
				| 
				Tulare 6-Station Index (map) | 
				30.50 | 
				57.00 | 
				187% | 
			 
			
				 | 
				 | 
				 | 
				 | 
			 
			
				 | 
				 | 
				4-year Deficit | 
			 
			
				| 
				...SOUTHERN CALIFORNIA... | 
				Normal | 
				in. | 
				% Normal | 
			 
			
				| 
				Sandberg | 
				12.33 | 
				26.35 | 
				214% | 
			 
			
				| 
				Palmdale | 
				8.30 | 
				18.96 | 
				228% | 
			 
			
				| 
				Santa Barbara | 
				17.76 | 
				33.75 | 
				190% | 
			 
			
				| 
				Los Angeles | 
				14.93 | 
				30.59 | 
				205% | 
			 
			
				| 
				Irvine | 
				13.33 | 
				31.49 | 
				236% | 
			 
			
				| 
				San Diego | 
				10.34 | 
				12.78 | 
				124% | 
			 
			
				| 
				Ontario | 
				15.04 | 
				30.95 | 
				206% | 
			 
			
				| 
				Riverside | 
				12.40 | 
				30.96 | 
				250% | 
			 
			
				| 
				Palm Springs | 
				5.74 | 
				13.09 | 
				228% | 
			 
			
				| 
				Campo | 
				15.73 | 
				24.47 | 
				156% | 
			 
		 
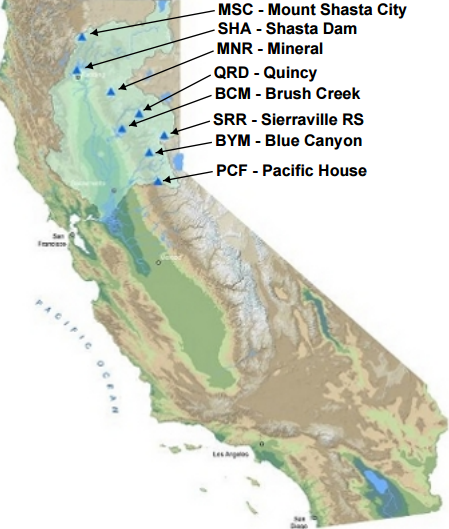
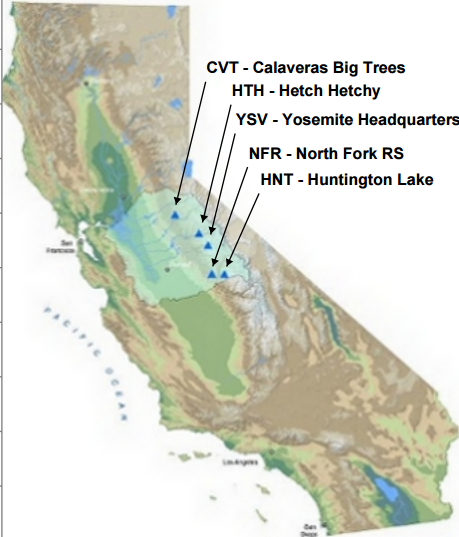
		 Note: - The averages for the three Sierra Nevada Indices (Northern 
		Sierra, San Joaquin and Tulare) have been recalculated to correspond 
		with the 1981-2010 normals used at the other sites. | 
		
		  |