Notes:
- There may be a minor differences between these figures and those published by some NWS offices and Calif. DWR, which uses the Oct. 1 Water Year instead of the historical California meteorological rainfall season of July 1 to June 30. See https://ggweather.posthaven.com/rainfall-season-vs-water-year
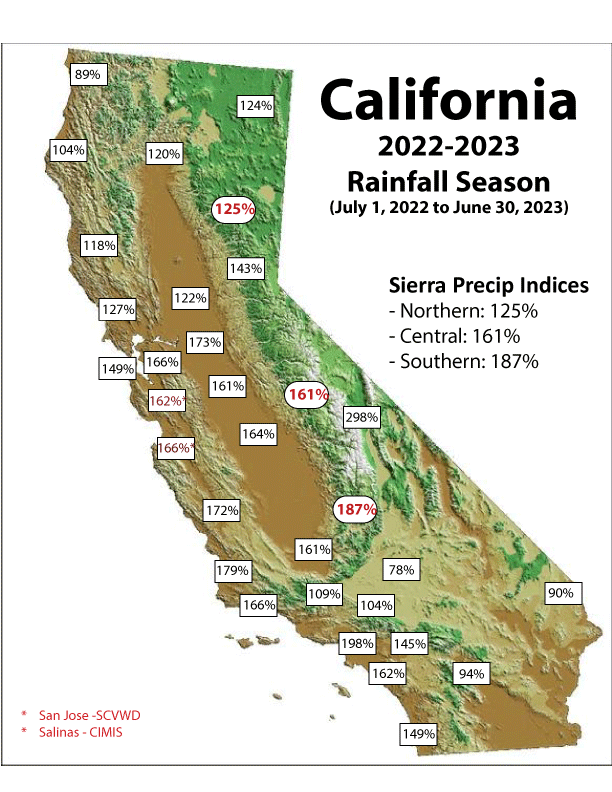
- The rainfall totals for San Jose have been calculated using data from the Santa Calra County Water District after erroneous data was discovered from the NWS San Jose Airport location.
The averages for the three Sierra Nevada Indices (Northern Sierra, San Joaquin and Tulare) have been recalculated to correspond with the standardized 1991-2020 30-year normals.
|
2022-2023 CALIFORNIA RAINFALL SEASON July 1 - June 30 1991-2020 NORMALS |
|||
| Northern California | Rain | Normal | % Normal |
| Crescent City | 51.86 | 57.98 | 89% |
| Eureka | 42.04 | 40.40 | 104% |
| Ukiah | 41.07 | 34.84 | 118% |
| Alturas | 16.67 | 11.68 | 143% |
| Mount Shasta City | 45.41 | 42.63 | 107% |
| Redding | 40.19 | 33.52 | 120% |
| Red Bluff | 27.66 | 23.12 | 120% |
| Sacramento Exec AP | 22.20 | 18.14 | 122% |
| Sacramento - CSUS | 26.63 | 19.20 | 139% |
| Blue Canyon | 89.62 | 62.44 | 144% |
| South Lake Tahoe | 37.73 | 20.46 | 184% |
| Santa Rosa | 42.82 | 33.78 | 127% |
| San Francisco Downtown | 34.19 | 22.89 | 149% |
| SFO Airport | 31.67 | 19.64 | 161% |
| Oakland Airport | 31.05 | 18.68 | 166% |
| Livermore | 21.63 | 15.18 | 142% |
| San Jose | 15.82 | 13.48 | 117% |
| Central California... | Rain | Normal | % Normal |
| Stockton | 23.22 | 13.45 | 173% |
| Modesto | 19.74 | 12.27 | 161% |
| Merced | 20.84 | 11.80 | 177% |
| Madera | 11.62 | 10.79 | 108% |
| Fresno | 17.83 | 10.99 | 162% |
| Hanford | 14.58 | 8.13 | 179% |
| Bakersfield | 10.26 | 6.36 | 161% |
| Bishop | 14.46 | 4.84 | 299% |
| Death Valley | 2.99 | 2.20 | 136% |
| Salinas | 13.99 | 12.58 | 111% |
| Paso Robles | 20.89 | 12.15 | 172% |
| Santa Maria | 23.84 | 13.32 | 179% |
| Southern California | Rain | Normal | % Normal |
| Sandberg | 14.27 | 13.14 | 109% |
| Palmdale | 6.28 | 5.90 | 106% |
| Lancaster | 7.07 | 6.81 | 104% |
| Santa Barbara | 28.65 | 17.25 | 166% |
| Camarillo | 23.06 | 12.01 | 192% |
| Burbank - Bob Hope | 26.90 | 13.91 | 193% |
| LAX Airport | 23.98 | 12.23 | 196% |
| Los Angeles Downtown | 28.26 | 14.25 | 198% |
| Long Beach | 21.14 | 12.02 | 176% |
| Fullerton | 22.52 | 11.86 | 190% |
| Irvine - John Wayne | 18.17 | 11.18 | 163% |
| Oceanside | 20.25 | 11.86 | 171% |
| Ramona | 24.54 | 14.65 | 168% |
| San Diego - Montgomery Fld | 16.22 | 11.02 | 147% |
| San Diego - Lindbergh | 14.60 | 9.79 | 149% |
| San Diego - Brown Field | 16.37 | 10.23 | 160% |
| Ontario | 24.17 | 11.64 | 208% |
| Riverside | 13.59 | 9.39 | 145% |
| Palm Springs | 4.34 | 4.61 | 94% |
| Thermal | 1.95 | 2.96 | 66% |
| Barstow-Daggett | 2.93 | 3.77 | 78% |
| Needles | 3.96 | 4.32 | 92% |
| produced by Jan Null, CCM Golden Gate Weather Services jnull@ggweather.com |
 |