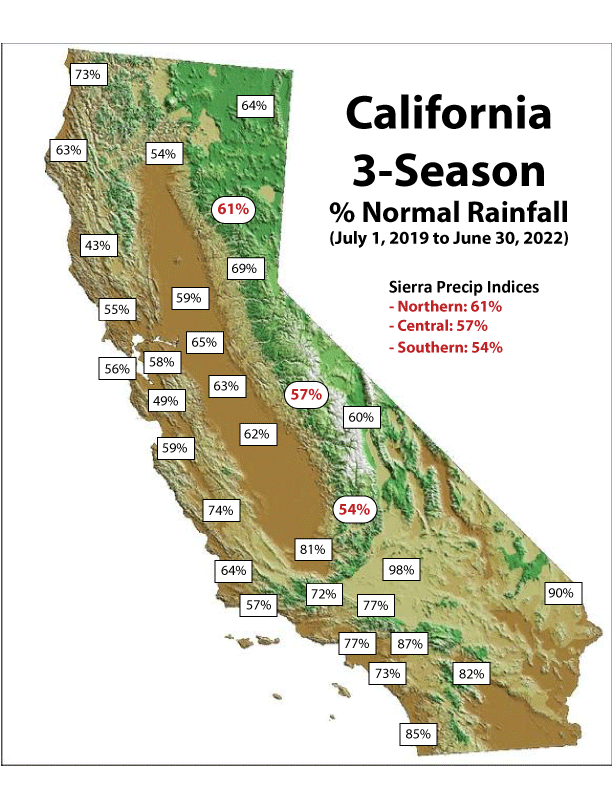
| California 3-Season Rainfall (Jul 2019-Jun 2022) | ||||||
| Northern California | 2019-2020 | 2020-2021 | 2021-2022 | 3-yr total | 3-yr normal | 3-yr % normal |
| Crescent City | 44.87 | 47.64 | 33.80 | 126.31 | 173.94 | 73% |
| Eureka | 31.76 | 25.14 | 19.50 | 76.40 | 121.2 | 63% |
| Ukiah | 14.87 | 13.56 | 16.04 | 44.47 | 104.52 | 43% |
| Montague/Siskiyou | 8.02 | 8.67 | 3.78 | 20.47 | 35.97 | 57% |
| Alturas | 10.64 | 5.73 | 6.13 | 22.50 | 35.04 | 64% |
| Mount Shasta City | 22.71 | 19.04 | 16.37 | 58.12 | 127.89 | 45% |
| Redding | 24.96 | 13.85 | 15.88 | 54.69 | 100.56 | 54% |
| Sacramento Exec AP | 9.83 | 6.58 | 15.85 | 32.26 | 54.42 | 59% |
| Sacramento - CSUS | 10.96 | 7.87 | 15.43 | 34.26 | 57.6 | 59% |
| Blue Canyon | 47.42 | 31.62 | 49.79 | 128.83 | 187.32 | 69% |
| Santa Rosa | 19.39 | 12.95 | 23.51 | 55.85 | 101.34 | 55% |
| San Francisco Downtown | 11.70 | 8.96 | 17.48 | 38.14 | 68.67 | 56% |
| SFO Airport | 9.18 | 7.87 | 17.15 | 34.20 | 58.92 | 58% |
| Oakland Airport | 8.89 | 7.62 | 15.89 | 32.40 | 56.04 | 58% |
| Livermore | 6.50 | 5.70 | 11.31 | 23.51 | 45.54 | 52% |
| San Jose | 7.34 | 5.33 | 7.00 | 19.67 | 40.44 | 49% |
| Nrn Sierra 8-Station Index | 31.38 | 23.28 | 42.11 | 96.77 | 158.43 | 61% |
| Central California | 2019-2020 | 2020-2021 | 2021-2022 | 3-yr total | 3-yr normal | 3-yr % normal |
| Stockton | 8.35 | 7.88 | 9.82 | 26.05 | 40.35 | 65% |
| Modesto | 7.17 | 7.12 | 9.02 | 23.31 | 36.81 | 63% |
| Merced | 9.66 | 7.00 | 7.44 | 24.10 | 35.4 | 68% |
| Fresno | 7.63 | 6.59 | 6.29 | 20.51 | 32.97 | 62% |
| Hanford | 6.62 | 4.29 | 6.34 | 17.25 | 24.39 | 71% |
| Bakersfield | 7.20 | 2.77 | 5.41 | 15.38 | 19.08 | 81% |
| Bishop | 2.27 | 1.62 | 4.82 | 8.71 | 14.52 | 60% |
| Salinas | 9.17 | 5.75 | 7.35 | 22.27 | 37.74 | 59% |
| Paso Robles | 11.52 | 6.76 | 8.70 | 26.98 | 36.45 | 74% |
| Santa Maria | 10.61 | 6.97 | 7.80 | 25.38 | 39.96 | 64% |
| Cntrl Sierra 5-Station Index | 24.54 | 18.35 | 24.91 | 67.80 | 118.77 | 57% |
| Srn Sierra 6-Station Index | 18.76 | 9.61 | 16.53 | 44.90 | 83.61 | 54% |
| Southern California | 2019-2020 | 2020-2021 | 2021-2022 | 3-yr total | 3-yr normal | 3-yr % normal |
| Sandberg | 15.40 | 2.62 | 10.19 | 28.21 | 39.42 | 72% |
| Palmdale | 8.62 | 1.84 | 3.14 | 13.60 | 17.7 | 77% |
| Lancaster | 10.69 | 1.32 | 4.14 | 16.15 | 20.43 | 79% |
| Santa Barbara | 11.61 | 7.31 | 10.53 | 29.45 | 51.75 | 57% |
| Camarillo | 11.82 | 2.94 | 11.45 | 26.21 | 36.03 | 73% |
| Burbank - Bob Hope | 14.50 | 4.85 | 9.96 | 29.31 | 41.73 | 70% |
| LAX Airport | 13.19 | 5.00 | 10.31 | 28.50 | 36.69 | 78% |
| Los Angeles Downtown | 14.88 | 5.82 | 12.40 | 33.10 | 42.75 | 77% |
| Long Beach | 14.24 | 4.47 | 7.46 | 26.17 | 36.06 | 73% |
| Fullerton | 12.44 | 4.75 | 6.75 | 23.94 | 35.58 | 67% |
| Irvine - John Wayne | 12.77 | 4.56 | 7.13 | 24.46 | 33.54 | 73% |
| Oceanside | 17.46 | 5.60 | 7.87 | 30.93 | 35.58 | 87% |
| Ramona | 18.57 | 7.81 | 10.53 | 36.91 | 43.95 | 84% |
| San Diego - Lindbergh | 13.61 | 4.51 | 6.83 | 24.95 | 29.37 | 85% |
| Ontario | 14.37 | 6.07 | 11.64 | 32.08 | 34.92 | 92% |
| Riverside | 10.76 | 4.38 | 9.39 | 24.53 | 28.17 | 87% |
| Palm Springs | 5.82 | 0.86 | 4.61 | 11.29 | 13.83 | 82% |
| Thermal | 6.17 | 0.35 | 2.96 | 9.48 | 8.88 | 107% |
| Barstow-Daggett | 6.66 | 0.62 | 3.75 | 11.03 | 11.31 | 98% |
| Needles | 7.07 | 0.31 | 4.30 | 11.68 | 12.96 | 90% |
| produced by Jan Null, CCM Golden Gate Weather Services jnull@ggweather.com |
 |