|
El Nińo
and La Nińa... Relationship to California Flood Damage 1949-50 to present Updated 6/14/2023
By
Jan
Null, CCM |
 |
|
El Nińo
and La Nińa... Relationship to California Flood Damage 1949-50 to present Updated 6/14/2023
By
Jan
Null, CCM |
|
|
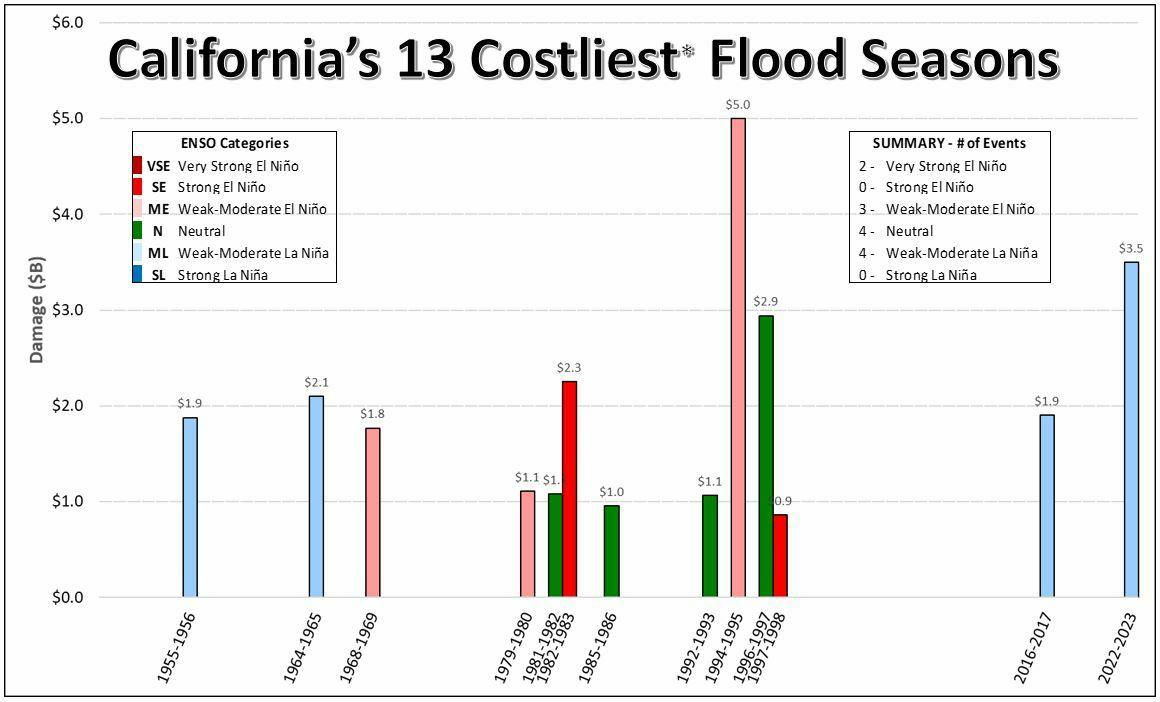
"Timing has a lot to do with the outcome of a raindance" ~ Anonymous It also has a great deal to do with the impact of rainfall on California. The winter season of 1997-1998 with a very strong El Niño occurring was one of the wettest on record across California, with typically double the normal amount of rainfall and about $850 million in flood and storm damage statewide. But not enough to be in the top 10 costiest California flood years. However, the previous non-El Niño season, with only normal rainfall, had over triple the damage ($2.9 billion). This discrepancy appears to be best explained by timing of storms within the season and not the total seasonal rainfall. This is an examination of the relationship between rainfall and flooding from 1949-50 until January 2023. The figure below shows the estimated statewide damage caused by storms and flooding in
California since the 1949-50 rainfall season. This data was complied from the
NOAA and California Governor's Office
of Emergency Services' records, and represents total for each rainfall season (i.e., July
1 to June 30). All amounts have been converted to 2023 dollars. The
colors of the individual bars indicated very strong El Nińo (dark red), strong (red), weak to
moderate El Nińo (light red), strong La Nińa (blue)
and weak and moderate La Nińa (light blue) and years which were "neutral" with no significant ENSO
signature (green). |
|||||||||||||||||||||||||||||||||||||||||||||||||||||||||
 |
|||||||||||||||||||||||||||||||||||||||||||||||||||||||||
|
Of the eigth seasons that exceeded $1.5 billion in statewide flood damage only three were El Nińo seaons; one very strong (1982) and two moderate (1994-95, 1968-69). |
|||||||||||||||||||||||||||||||||||||||||||||||||||||||||
| Thirteen Costliest California Flood Seasons (1949-50 to 2022-23) | |||||||||||||||||||||||||||||||||||||||||||||||||||||||||
|
|||||||||||||||||||||||||||||||||||||||||||||||||||||||||
|
Notes: 1 Damage is calculated in 2023 Dollars |
|||||||||||||||||||||||||||||||||||||||||||||||||||||||||
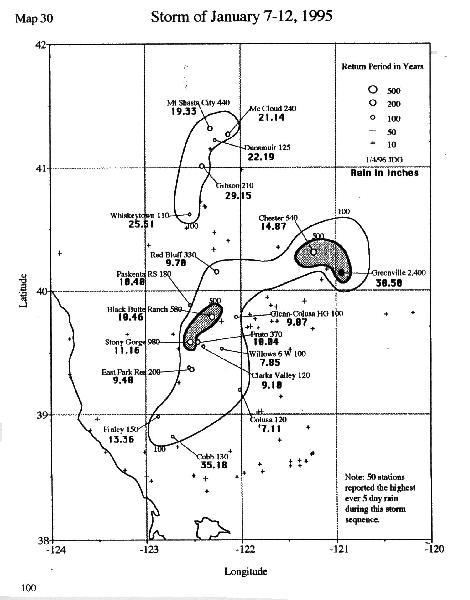
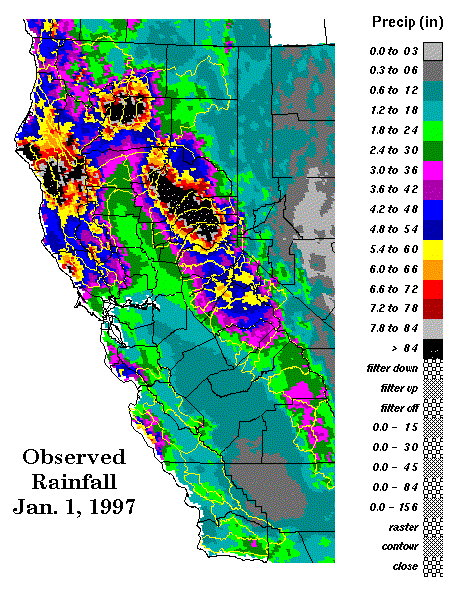
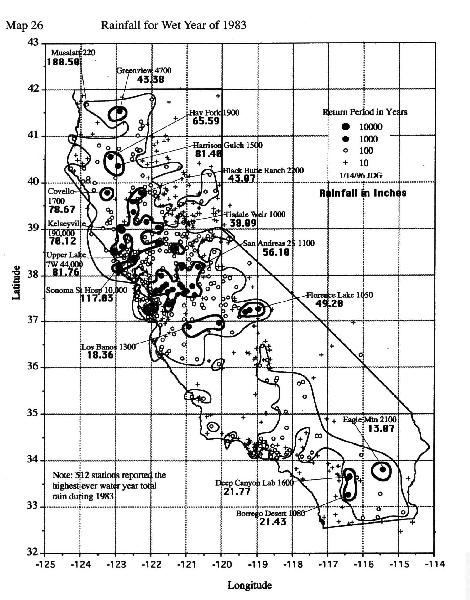
A closer look at the seasons with the most damage shows occurrences of high intensity-short duration precipitation events that overwhelmed California's flood control capabilities. Examination of several of these events shows some important common characteristics as well as the differences between ENSO and non-ENSO years. January and March 1995 Storms were both events of extremely high one day rainfall rates concentrated over a relatively small region (i.e., less than 100 miles wide). Figure 1 and Figure 2 (Goodridge, 1997) show areas where there were large swaths where 100-year storms occurred, with embedded 500 and 1000-year events. These events had over 100 stations which had their greatest one day rainfalls in the station's history. New Years Storm 1997 was another relatively short-duration high intensity storm. Figure 3 (Archer, 1997) shows the 24 hour rainfall across northern California with several regions exceeding 8 inches for the period. Several more comparable days, with the addition of significant snowmelt in the Sierra Nevada led to widespread flooding in the Sacramento and San Joaquin Valleys. Goodridge noted over 50 stations in the period from December 20, 1996 to January 3, 1997 that received their historical one day totals. Interestingly, the seasonal rainfall totals for most of California were very close to their 30 year normals. Winter 1982 - 1983 was during a very strong ENSO event with near record seasonal rainfalls over a large portion of California with 512 stations reporting their highest seasonal totals ever (see Figure 4). There was generalized flooding over a wide area without the benefit of any single major high intensity event with about $854M in damage. Additionally, on October 26, 1982 another $563M in agricultural damage was reported in central California when tropical moisture from former Hurricane Sergio spread over the state. |
|||||||||||||||||||||||||||||||||||||||||||||||||||||||||
Sources: Archer, S., Analysis of the New Years Flood, National Weather Service, 1997. California Governor's Office of Emergency Services, Personal communication, 1998. Goodridge, J.D., Historic Rainstorms in California, California Department of Water Resources, Sacramento, 1997. Monteverdi, J. and J. Null, El Nińo and California Precipitation, Western Region Technical Attachment No. 97-37, November 21, 1997 . NOAA National Centers for Environmental Information (NCEI), U.S. Billion-Dollar Weather and Climate Disasters (2023). Null, J. and J. Monteverdi, La Nińa & California Rainfall, San Francisco State University, 1998. |
Copyright
© 2023, Golden Gate Weather Services.
Reproduction in full or part is prohibited without
permission.