|
This is a catalog of nationwide "winter"
precipitation anomalies for previous La Niña events. This is a climatological analysis
and not a forecasting tool. Please note that even within a
single category the broad range of conditions; some that are decidedly "atypical".
The
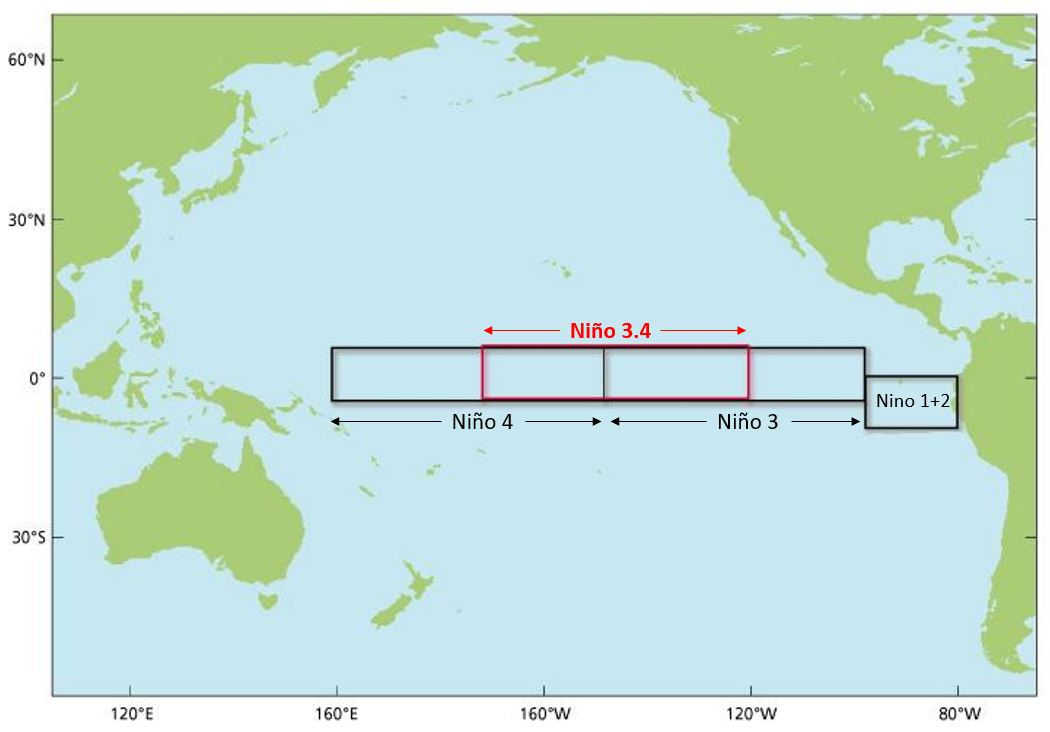
Relative Oceanic Niño Index (RONI)
is used to identify El Niño (warm) and La Niña (cool) events in the
tropical Pacific. The RONI is the running 3-month mean SST anomaly for the
Niño 3.4 region (i.e.,
5°N-5°S, 120°-170°W)
minus the
overall average tropical 3-month sea surface temperature anomaly (SSTA).
Events are defined as 5 consecutive overlapping 3-month periods at or
above the +0.5o anomaly for warm (El Niño)
events and at or below the -0.5 anomaly for cool (La Niña)
events.
El NIño thresholds are broken down into Weak (with a 0.5°
to 0.9° SST anomaly), Moderate (1.0° to 1.4°), Strong (1.5° to 1.9°),
and Very Strong (≥ 2.0°) events. For
the purpose of this report for an event to be weak, moderate, strong or
very strong it
must have equaled or exceeded the higher threshold for at least 3 months.
Weak: 1992-1993, 2004-2005, 2006-2007, 2014-2015,
2018-2019
Moderate:
1986-1987,1994-1995,
2002-2003, 2009-2010, 2023-2024
Strong: 1987-1988
Very Strong: 1982-1983, 1991-1992, 2015-2016 |
La NIña thresholds are broken
down into Weak (with a -0.5° to -0.9° SST anomaly), Moderate
(-1.0° to -1.4°), Strong (-1.5° to -1.9°) events. For the
purpose of this report for an event to be weak, moderate, strong
or very strong it much have equaled or exceeded the higher
threshold for at least 3 months.
Weak: 1983-1984, 1984-1985,
1995-1996, 2000-2001, 2005-2006, 2008-2009, 2011-2012, 2024-2025,
2025-26
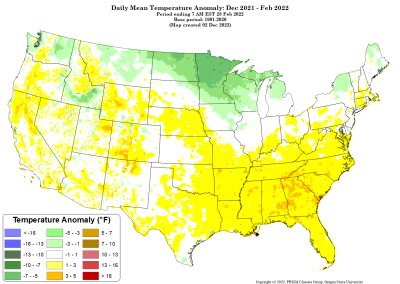
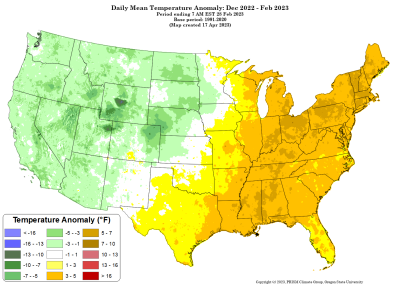
Moderate: 2016-2017, 2017-2018, 2020-2021, 2021-2022,
2022-0223
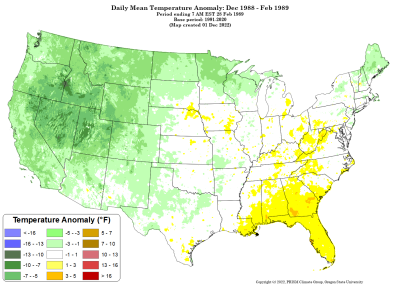
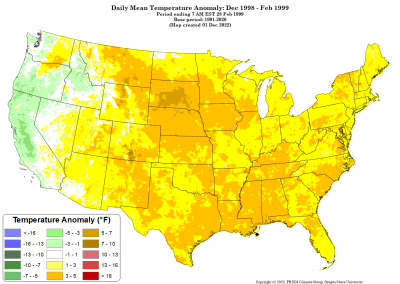
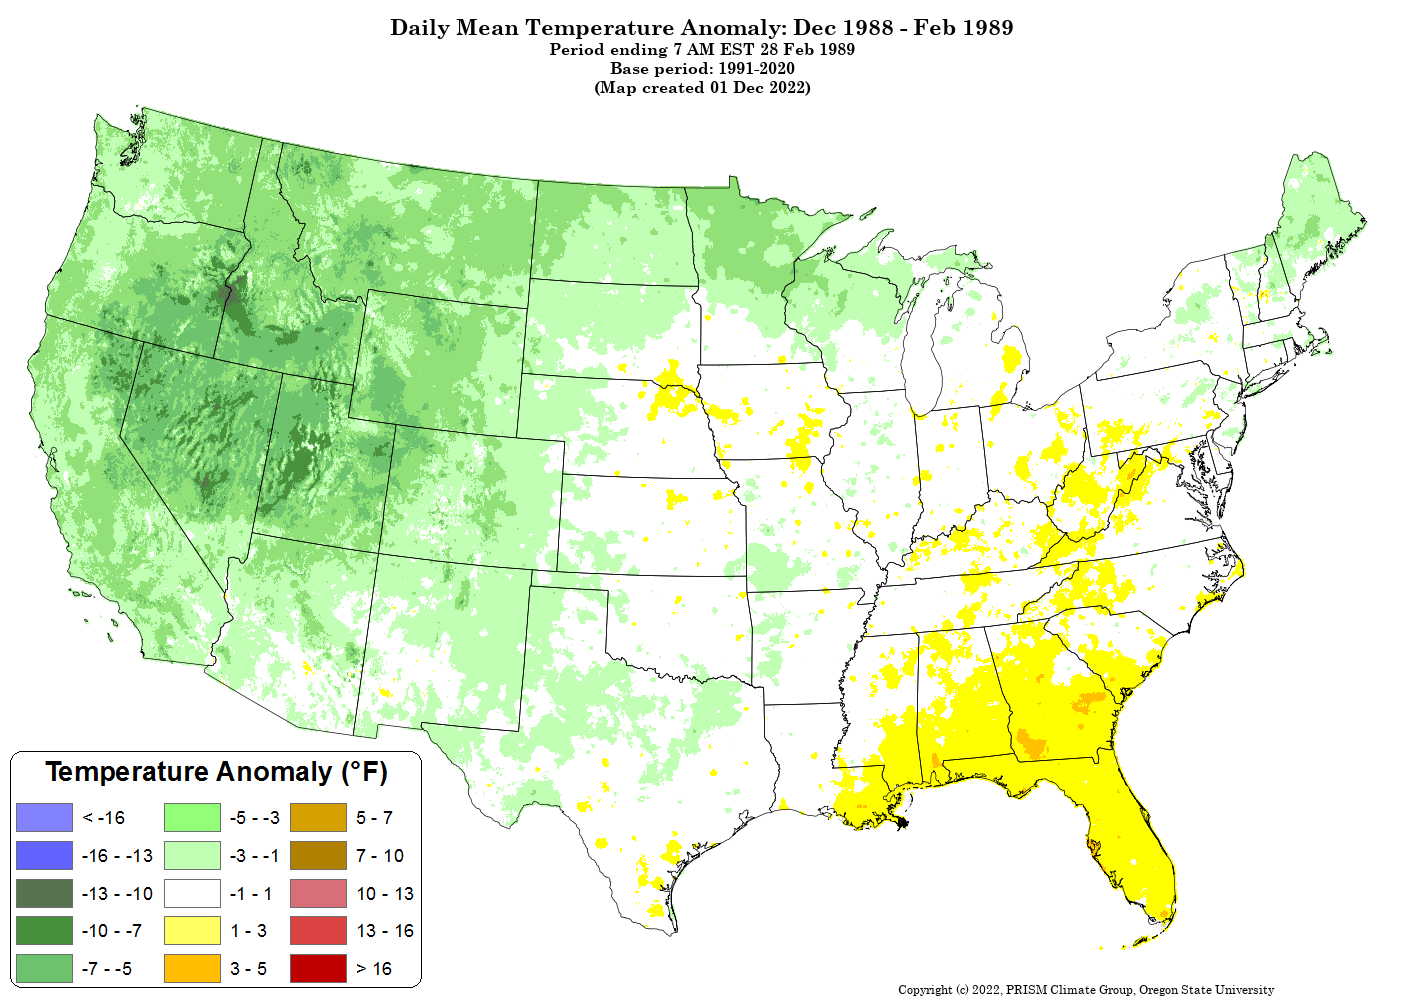
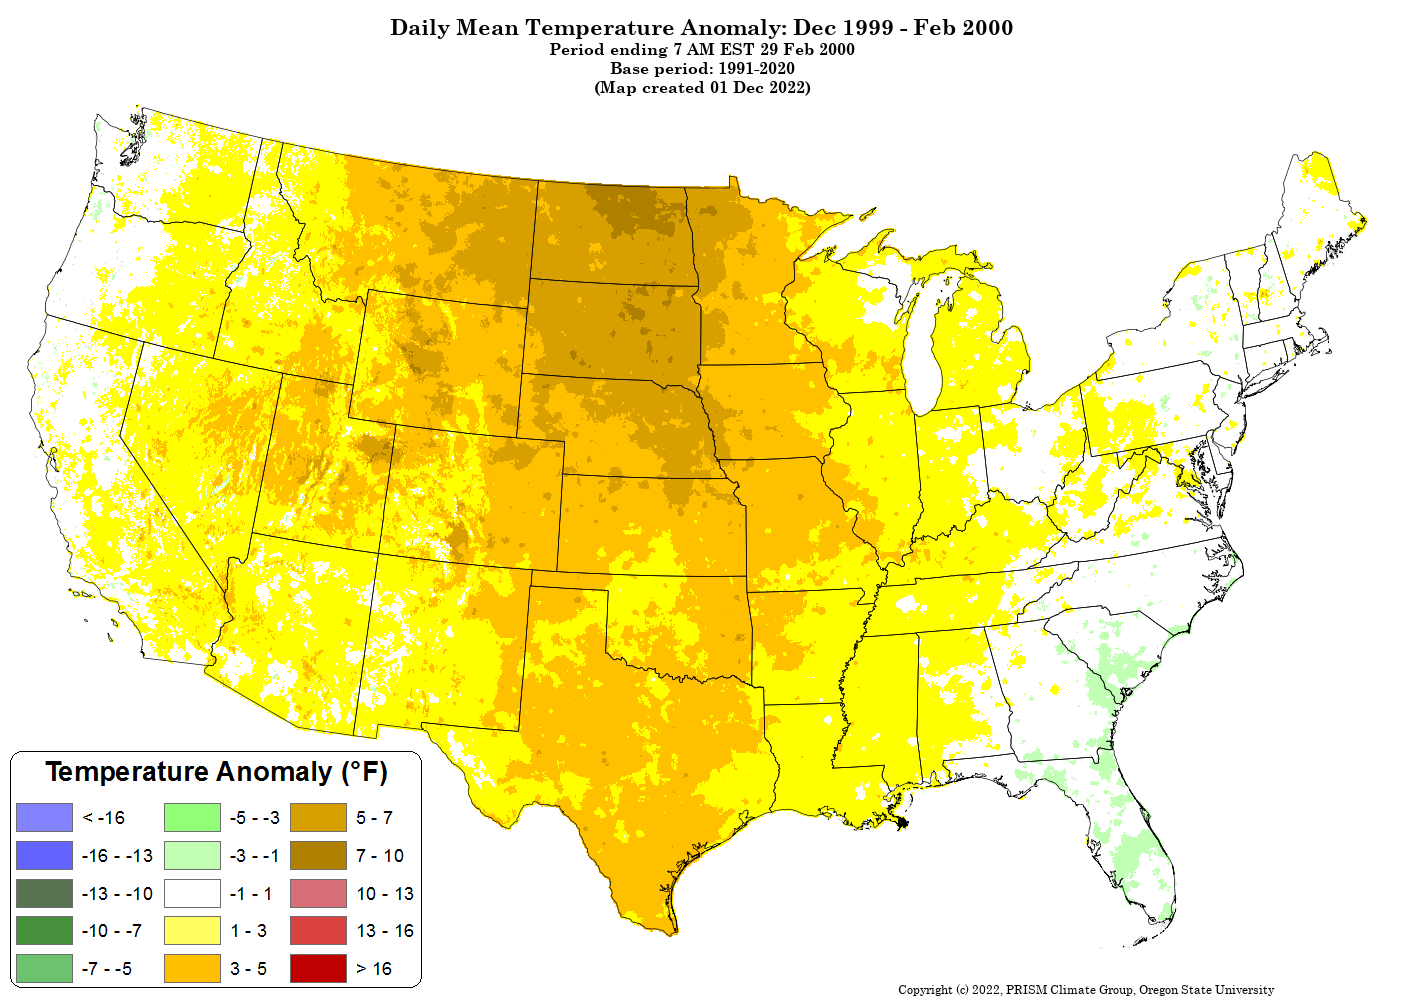
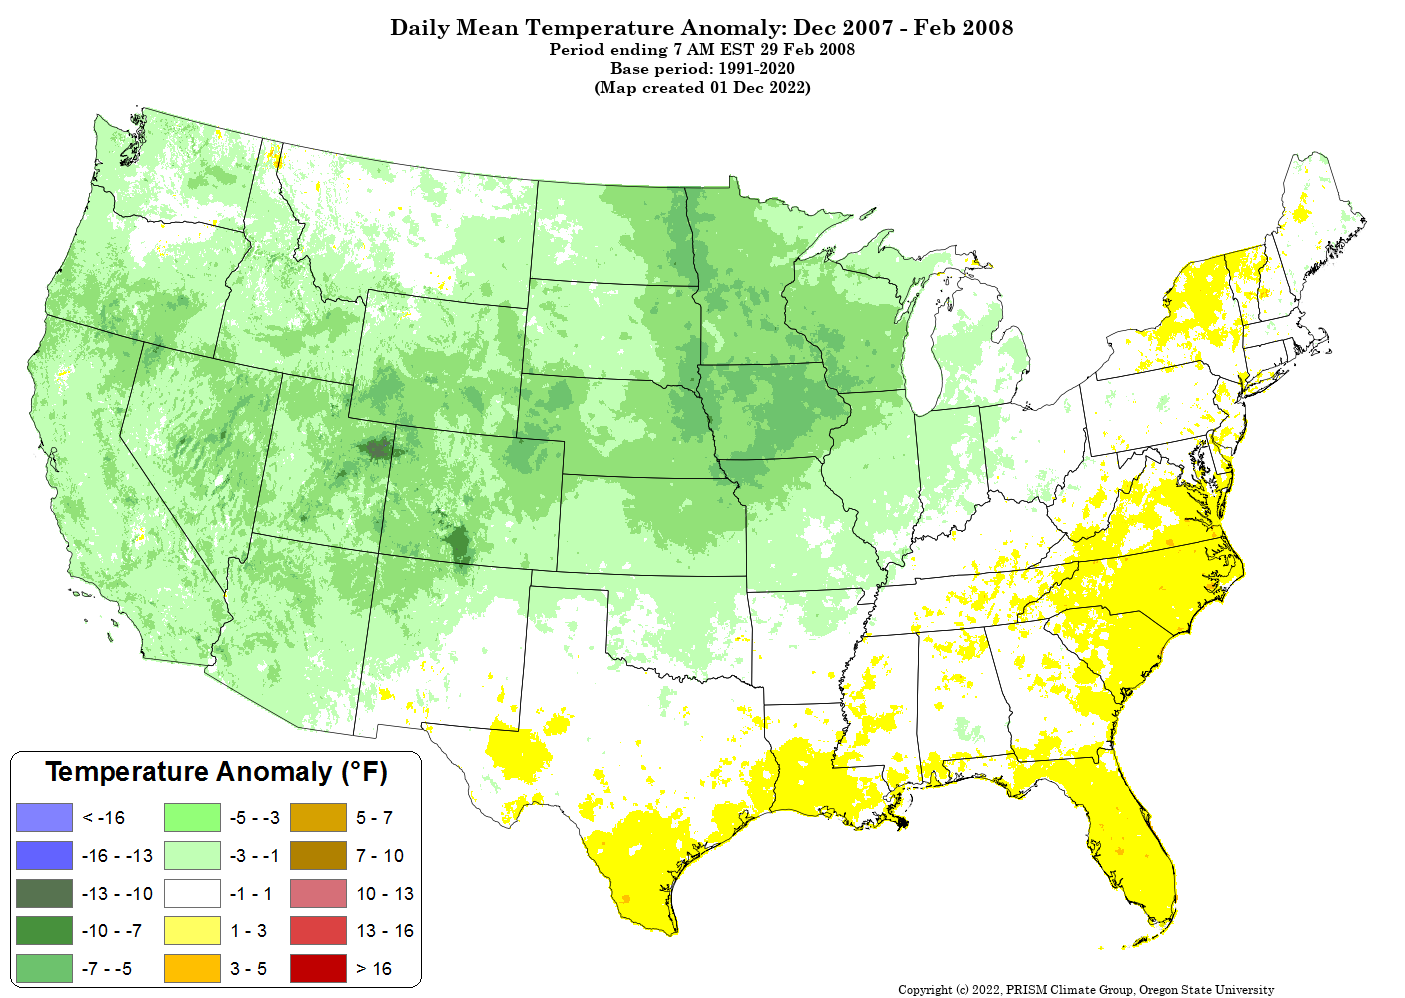
Strong: 1988-1989,
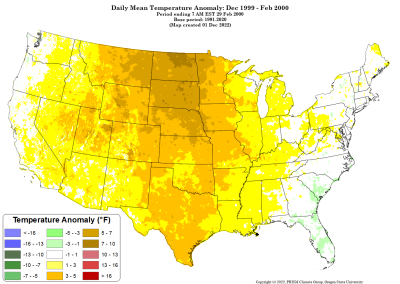
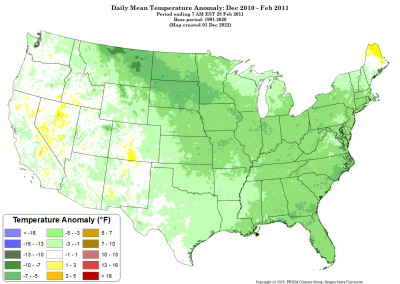
1998-1999, 1999-2000, 2007-2008, 2010-2011 |
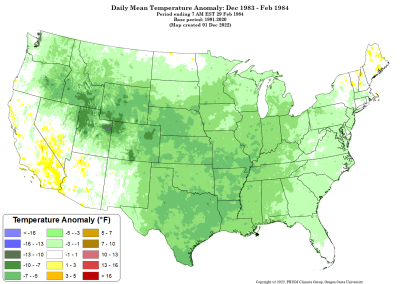
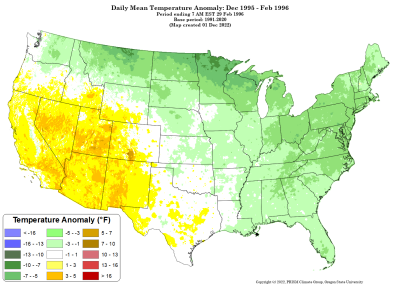
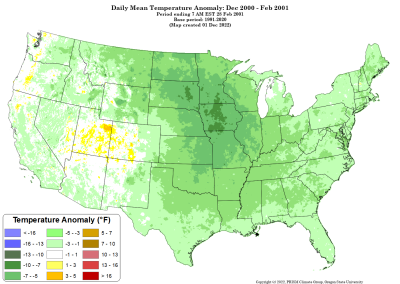
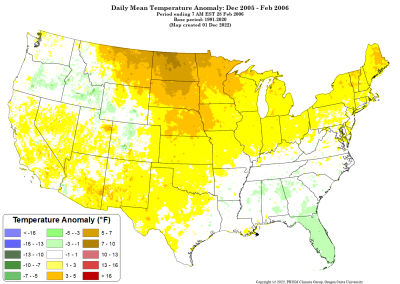
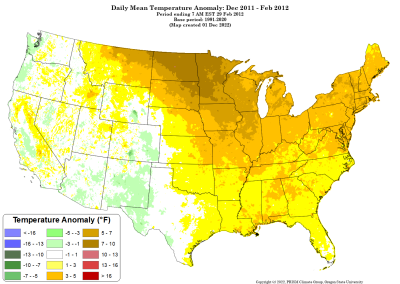
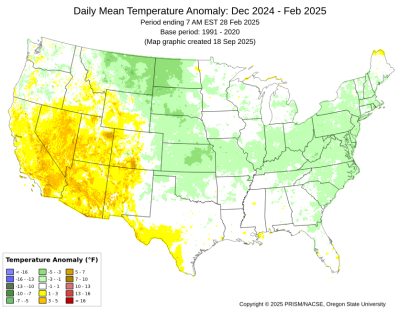
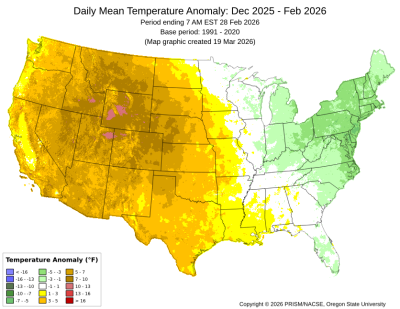
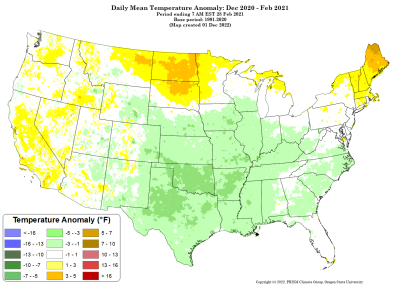
* December through February.
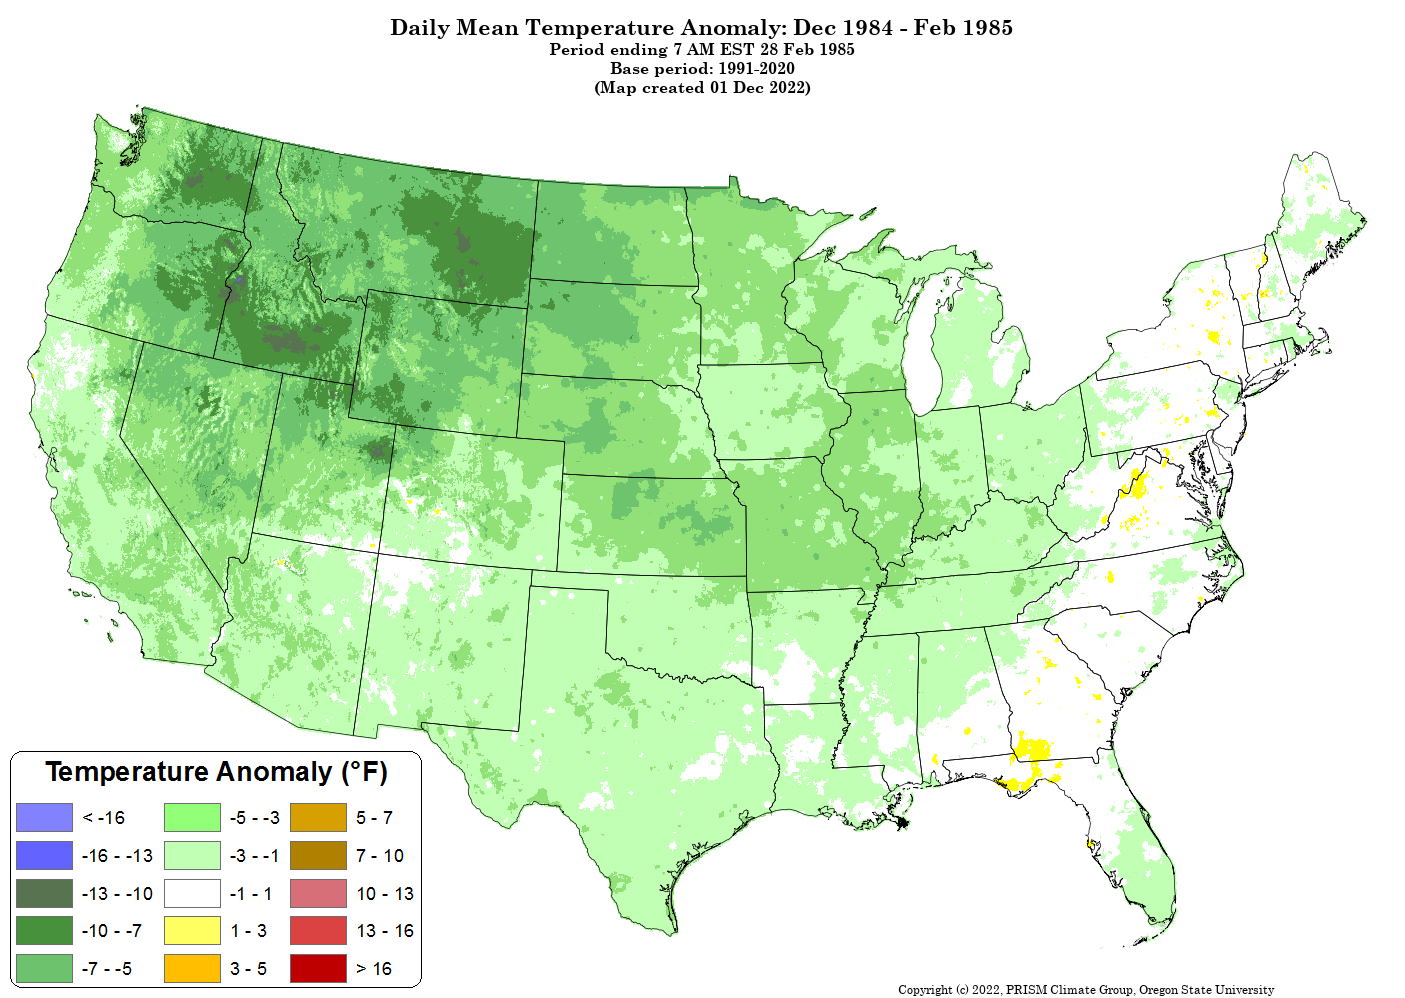
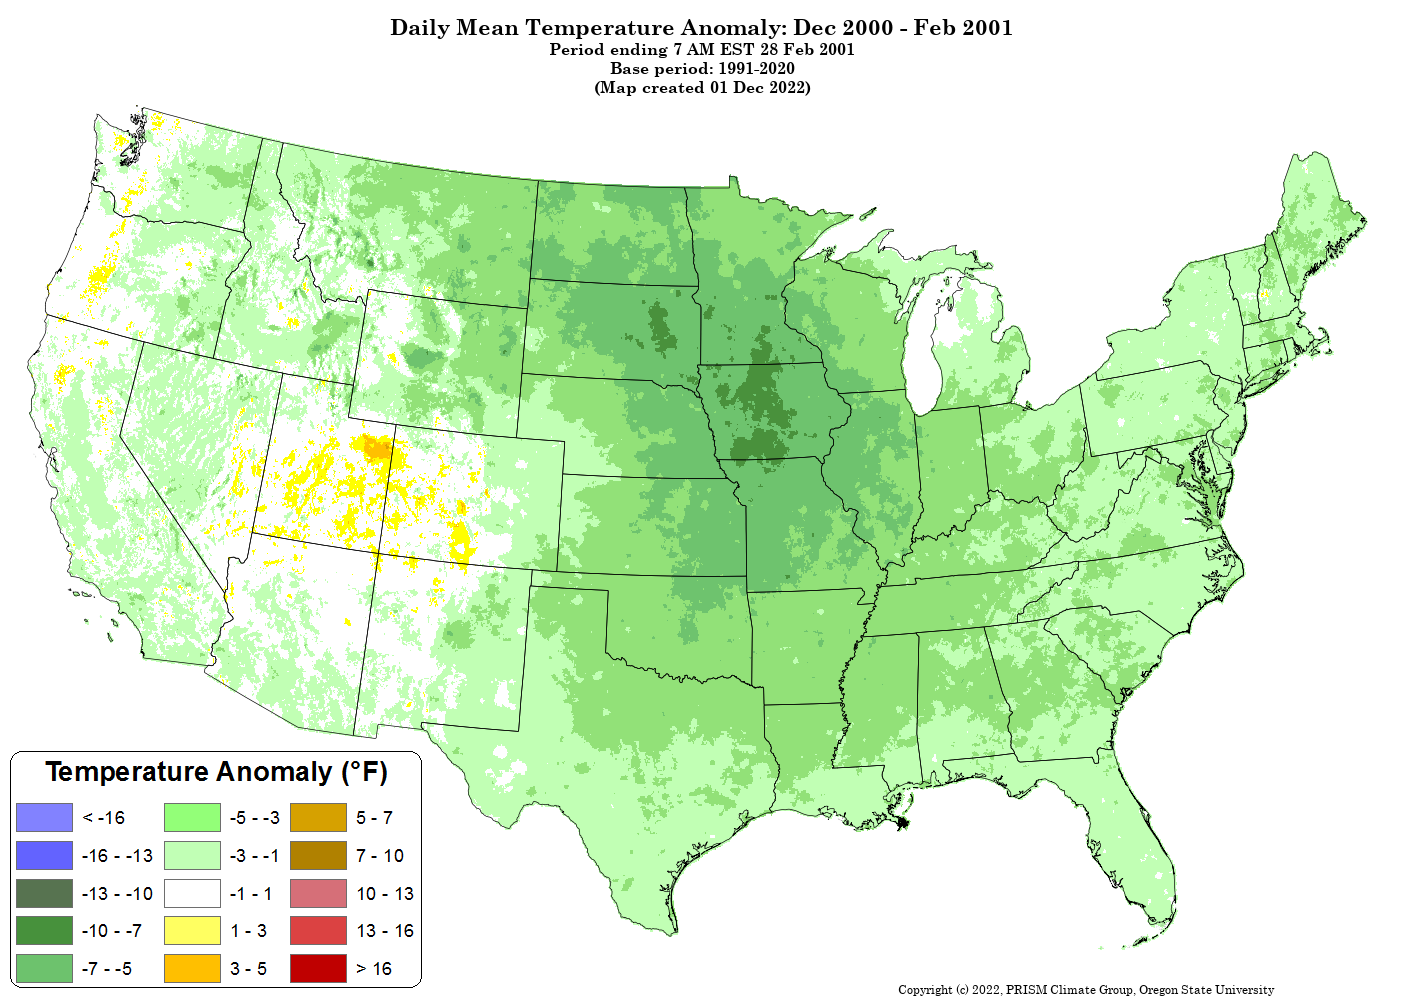
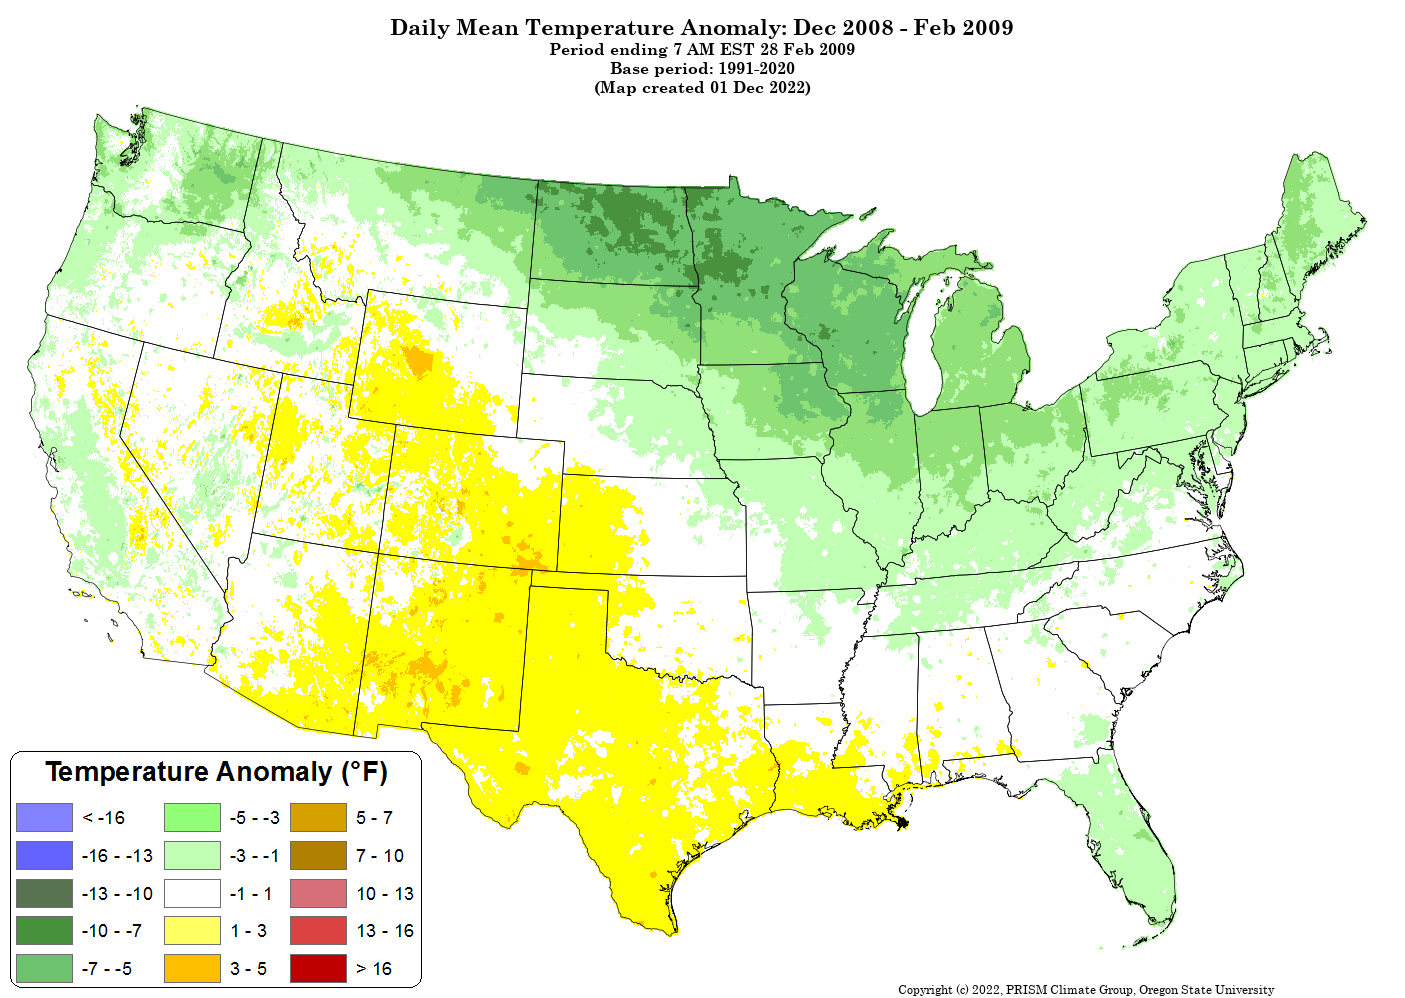
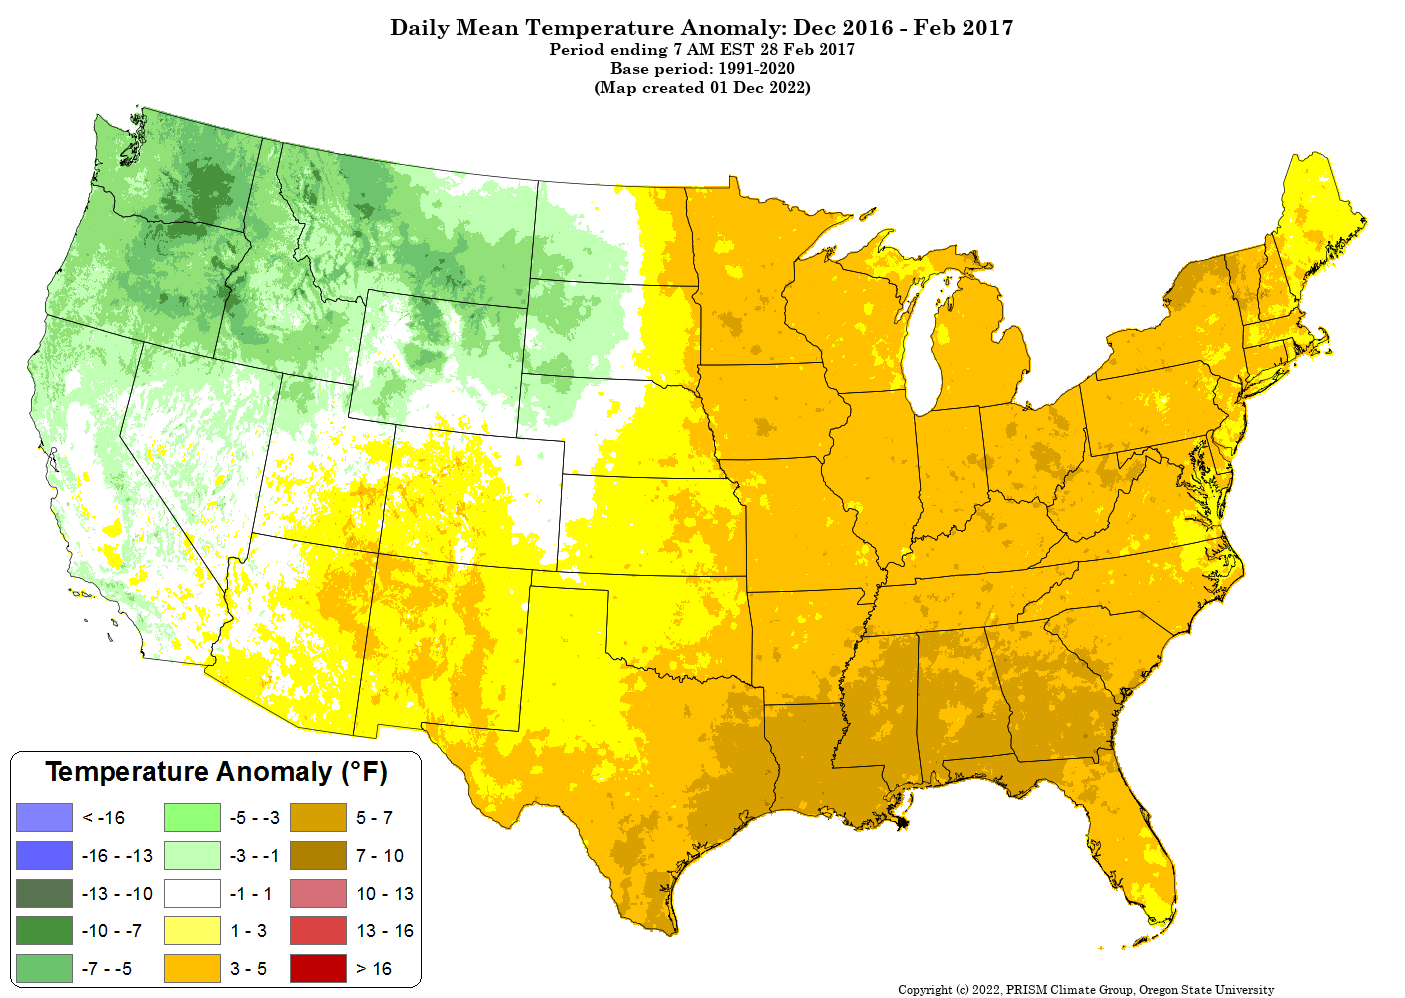
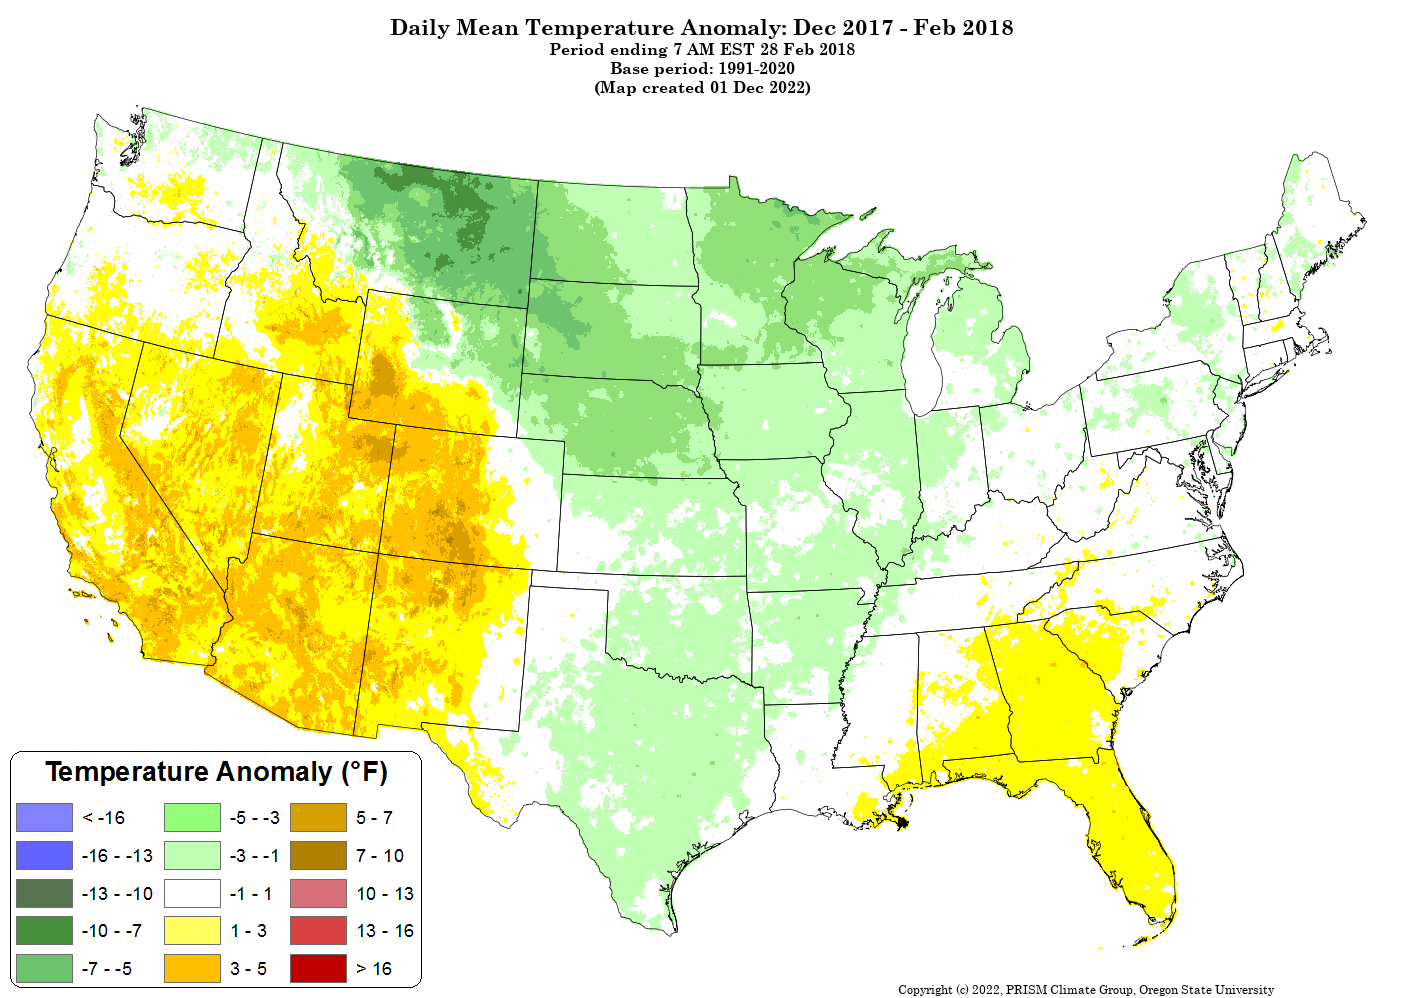
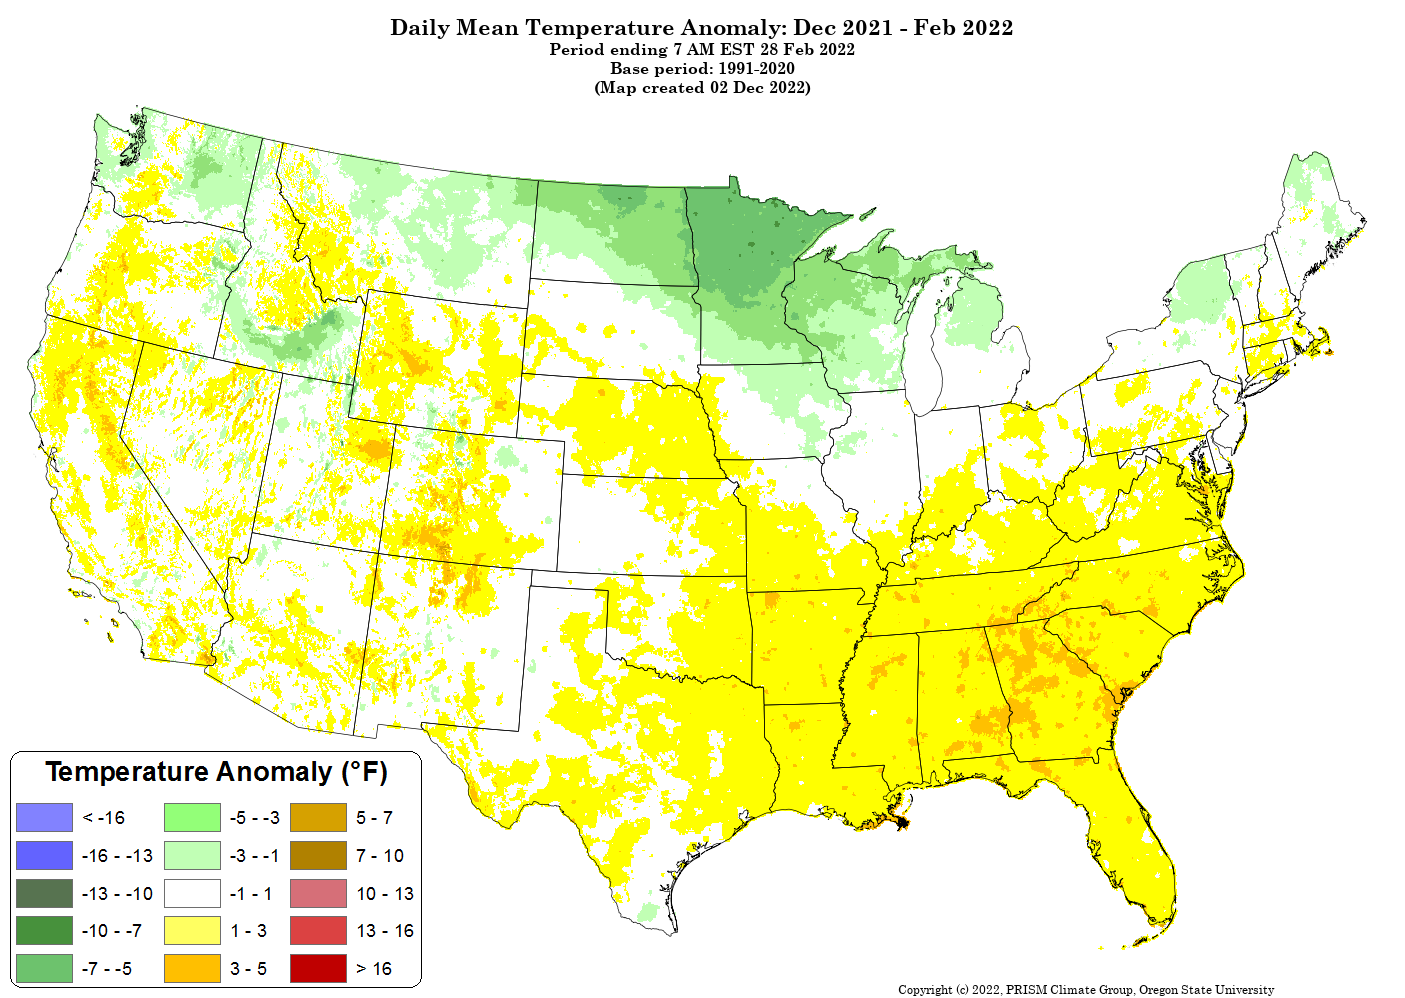
La
Niña Temperature Anomalies:
Winter (December, January, February)
|
Weak La Niña
(ONI =
-0.5 to -0.9
°C) |
|
1983-84 |
1984-85 |
1995-1996 |
 |
 |
 |
|
2000-2001 |
2005-2006 |
2008-2009 |
 |
 |
 |
|
2011-2012 |
2024-2025 |
2025-2026 |
 |
 |
 |
|
|
Moderate La Niña
(ONI =
-1.0 to -
1.4 °C) |
|
2016-2017 |
2017-2018 |
2020-2021 |
 |
 |
 |
|
2021-2022 |
2022-2023 |
|
 |
 |
|
|
|
Strong La Niña
(ONI =
-1.5 to -
1.9 °C) |
| 1988-1989 |
1998-1999 |
1999-2000 |
 |
 |
 |
|
2007-2008 |
2010-2011 |
|
 |
 |
|
|
|


