1997 - 1998 San Francisco Rainfall Season in Review |
 |
|
by Jan Null, CCM |
1997 - 1998 San Francisco Rainfall Season in Review |
|
|
by Jan Null, CCM |
| The 1997-1998 rainfall season was
one of nearly epic proportions for San Francisco. Numerous San Francisco records
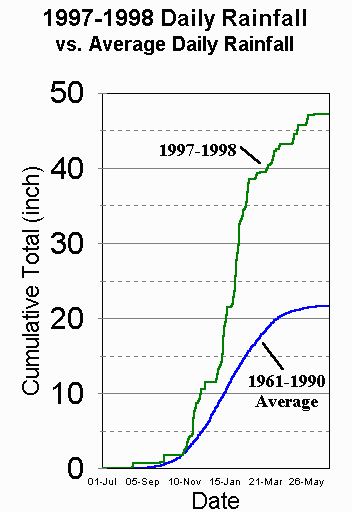
were set as the influences of an extremely strong El Niño were felt throughout the State. Most notably it was the second wettest rainfall season (47.22 inches) in the 149 seasons since records began in San Francisco in 1849. The previous second wettest season was 45.85 inches in 1889-1890. The seasonal record remains 49.27 inches from 1861-1862; however over 24 inches of that season's total fell in the month of January 1862. [The average seasonal rainfall (1961-1990) is 20.52 inches.] Possibly more remarkable were the record 119 days when measurable rainfall was recorded, shattering the previous mark of 107 from the 1889-1890 season. Click here to see each day and amount that it rained during the season.
|
 [Click
to Enlarge] [Click
to Enlarge]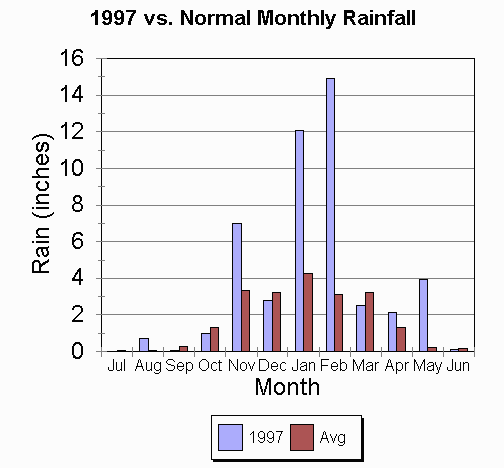 |
| Monthly Summaries | Highlights |
|---|---|
| July 1997 - 0.00 inches, 0 days [Average .02 inches, <1 day] | |
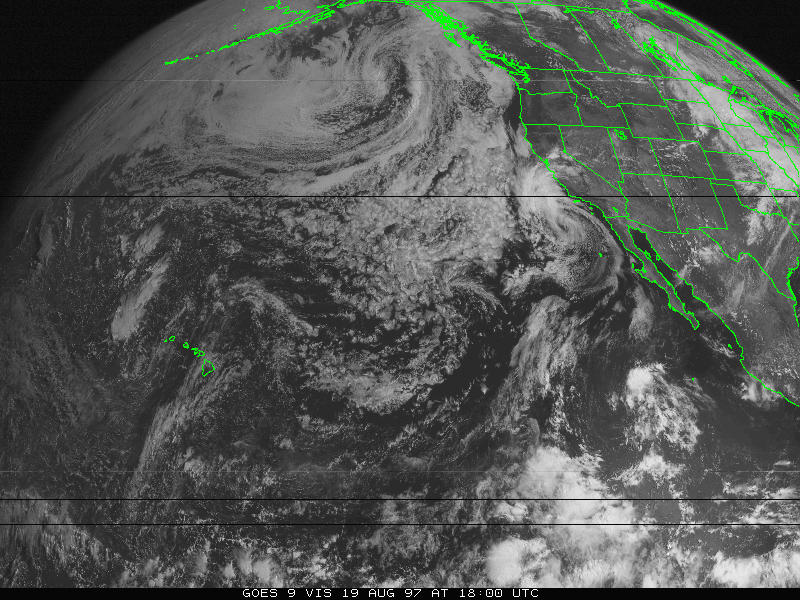
| August 1997- 0.73 inches, 2 days [Average .03 inches, 1
day] The remnants of Hurricane Ignacio on the 19th (see graphic, click to enlarge) and 20th made this the second wettest August on record. (The wettest August on record was .78 inches in 1976). The rainfall total on the 19th was a record .54 inches. |
|
| September 1997- 0.04 inches, 1 day [Average .28 inches, 2 days] | |
| October 1997- 1.00 inches, 3 days [Average 1.02 inches, 4 days] | |
| November 1997- 6.97 inches, 18 days [Average 2.60 inches, 8 days] | |
| December 1997- 2.77 inches, 10 days [Average 4.12 inches, 11 days] | |
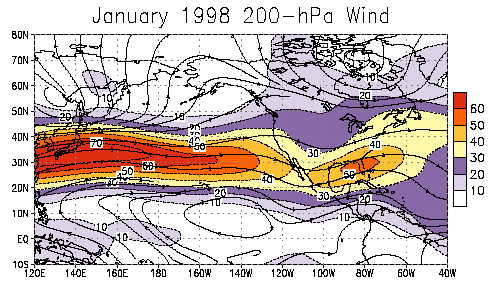
| January 1998- 12.08 inches, 22 days [Average 4.60 inches,
11 days] The first significant influences of El Niño are felt as a very strong Jet Stream (see graphic, click to enlarge) consolidated across the Pacific between 30N and 40N, bringing a series of strong storms to the Bay Area. This pattern was reminiscent of January 1983, another strong El Niño year. |
 |
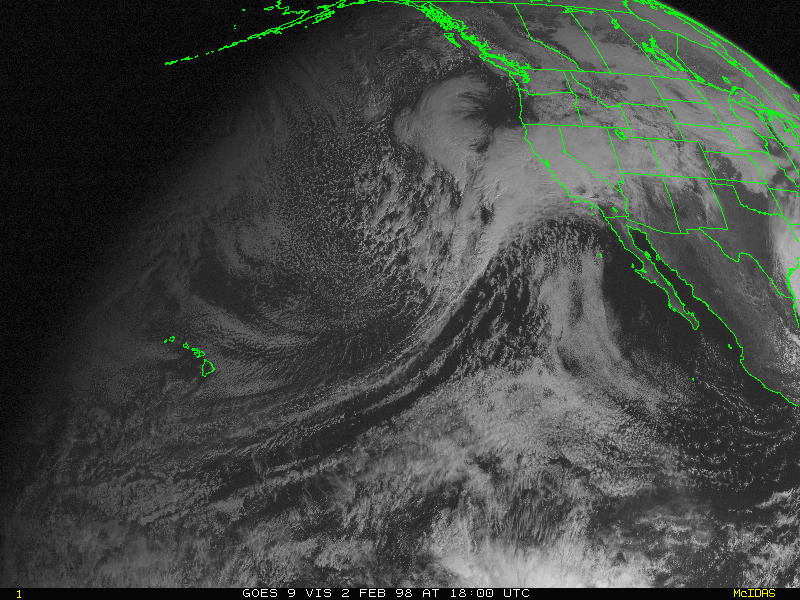
| February 1998- 14.89 inches, 20 days [Average 3.57
inches, 10 days] February saw San Francisco and the Bay Area absorb the full force of El Niño enhanced storms. The 14.89 inches of rain shattered the 12.52 record from 1878; and the 20 days of rain tied the 1915 record. Daily records were set on the 2nd, 6th and 7th with 2.93, 1.78 and 1.71 inches respectively. The images to the right are a visible image of the wettest day of the season on the 2nd, and an infrared image from the 5th. Both are characteristic of the type of storm systems seen through much of January and February. |
  |
| March 1998- 2.54 inches, 14 days [Average 3.13 inches, 10 days] | |
| April 1998- 2.13 inches, 10 days [Average 1.47 inches, 6
days] Most of the April rain was consolidated in the first 13 days of the month, with a record day of .84 inches on the 3rd. |
|
| May 1998- 3.92 inches, 14 days [Average .57 inches, 3
days] A series of cold cutoff lows from the Gulf of Alaska kept San Francisco wet and stormy. The 14 days of rain broke the 1957 record of 13days, while the monthly total of 3.92 inches was second only to the 4.02 that fell in 1957. A daily record of 0.59 inches was set on the 28th. |
|
| June 1998- 0.15 inches, 5 days [Average .15 inches, 1 day] |
Go to Climate of San Francisco Page
Return to Golden Gate Weather Services
Copyright © 1999, Golden Gate Weather
Services.
Reproduction in full or part is prohibited without permission.